Unlock a world of possibilities! Login now and discover the exclusive benefits awaiting you.
- Qlik Community
- :
- Forums
- :
- Analytics
- :
- App Development
- :
- Points' display limit in MapObject?
- Subscribe to RSS Feed
- Mark Topic as New
- Mark Topic as Read
- Float this Topic for Current User
- Bookmark
- Subscribe
- Mute
- Printer Friendly Page
- Mark as New
- Bookmark
- Subscribe
- Mute
- Subscribe to RSS Feed
- Permalink
- Report Inappropriate Content
Points' display limit in MapObject?
I have a data set that contains ~85,000 GeoPoint locations and I am trying to display it in the MapObject.
There are several fields in the data set to identify each location:
ID,
Longitude,
Latitude,
Location,
I've created a GeoKey using GeoMakePoint(Latitude, Longitude) as GeoKey
IDs and GeoKeys are unique values for all records, Locations are not (since Location is just the name of the City):
For example: several "London" locations are present in the data set:
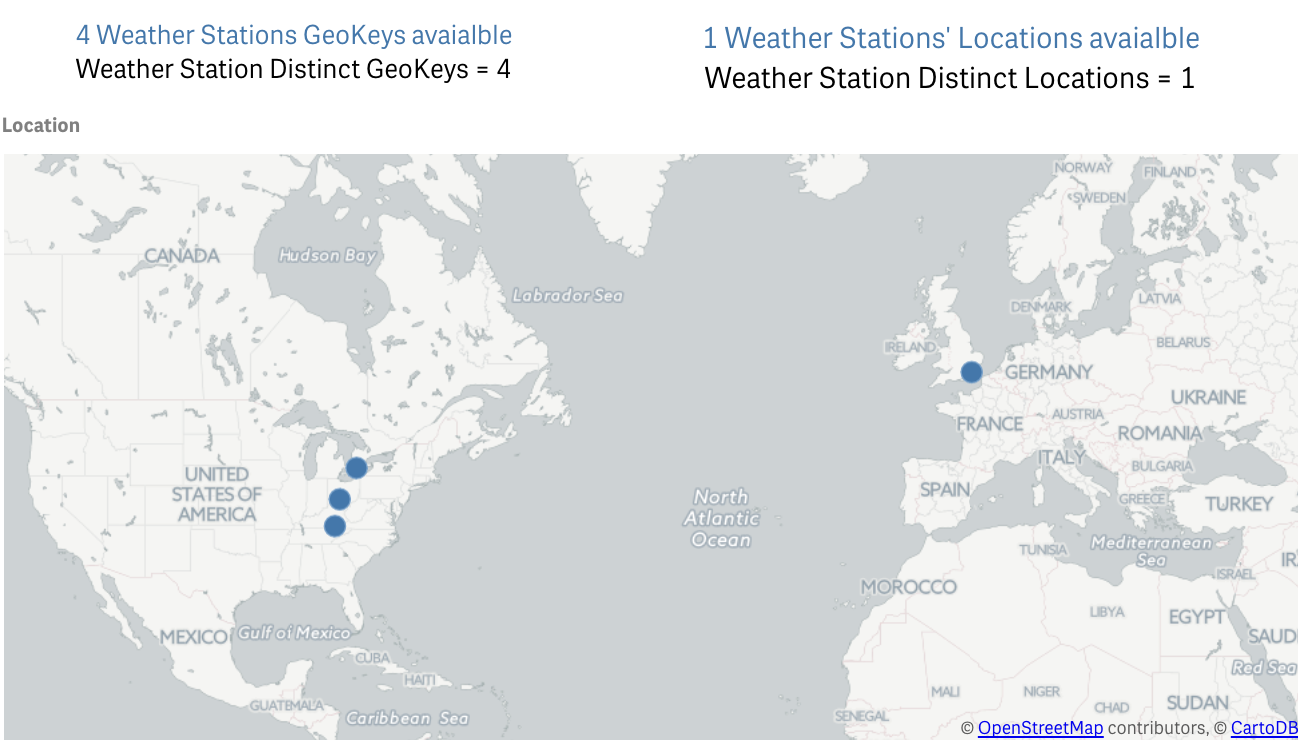
If I am selecting the "Location" field as a PointLayer in the MapObject - the data is displayed correctly (for all available data points):
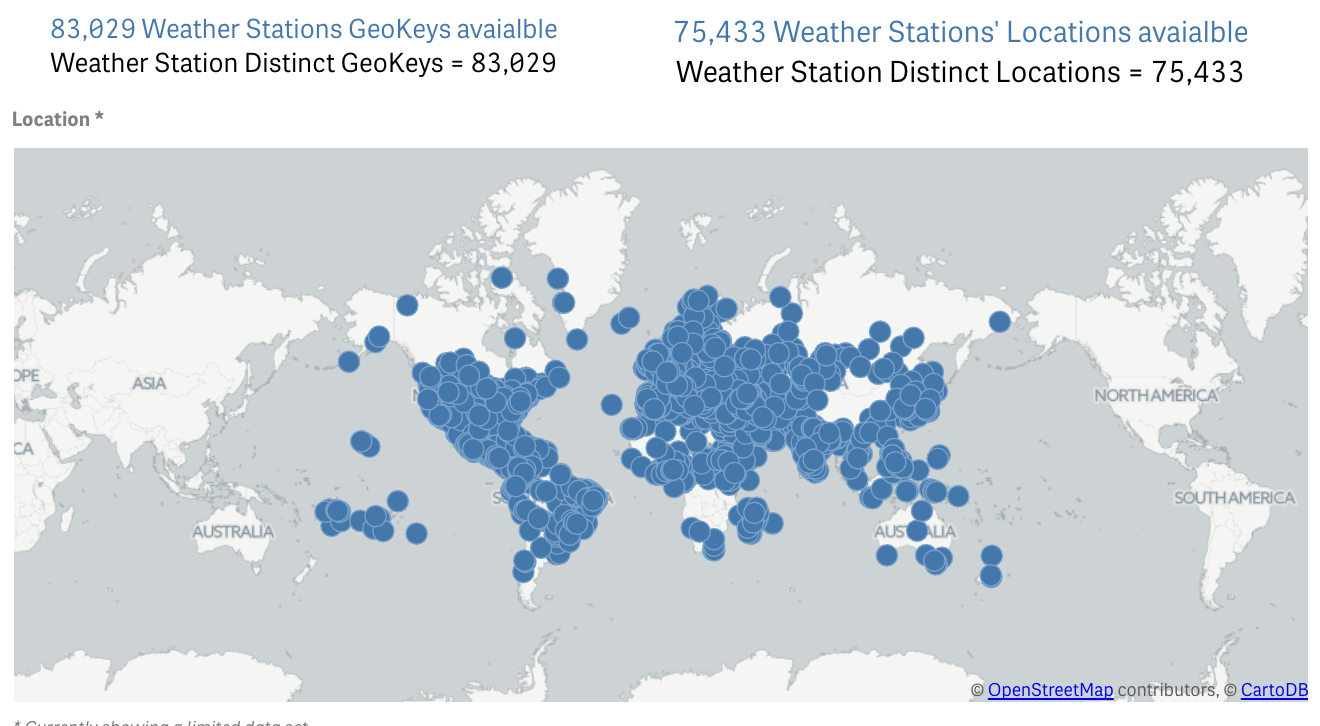
But as I've mentioned above, I would like to use unique values (IDs, for example) to display ALL data points properly.
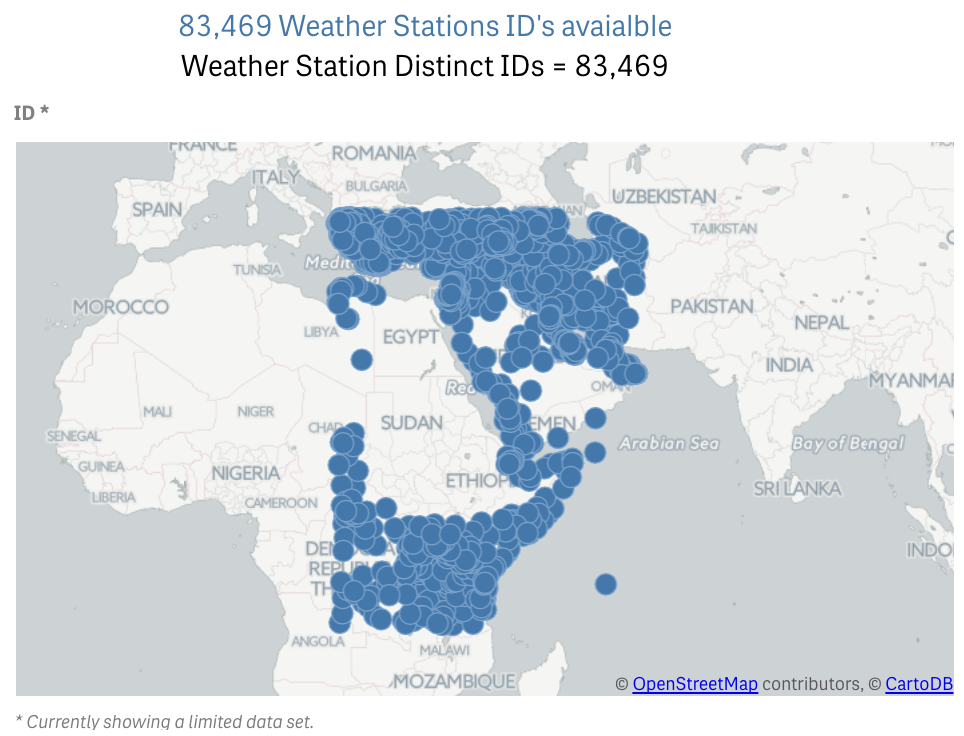
Here is how MapObject displays the SAME data set (using IDs in the PointLayer):
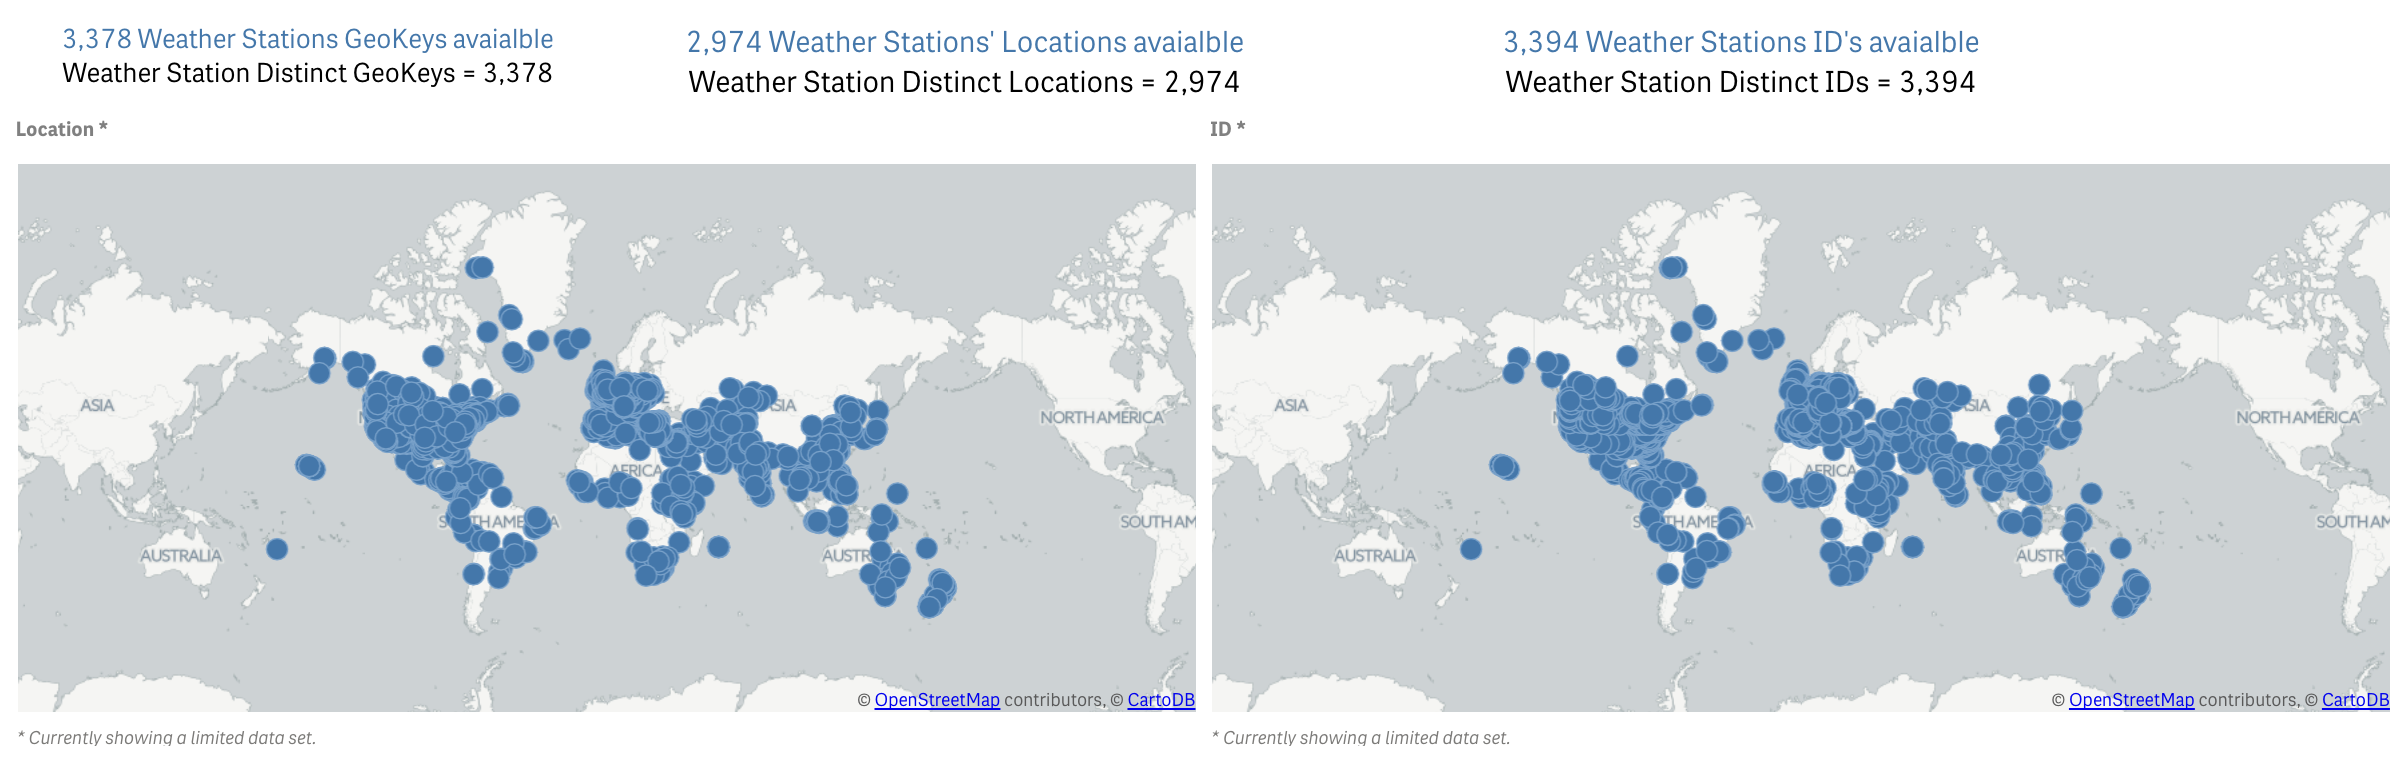
Looks like the problem disappears if I am selecting a significantly less number of data points (~3,300 vs ~83,000):
All points are displayed properly on both MapObjects:
Is there any limit of GeoPoint the MapObject is able to handle? Or the issue is related to the way the data and data points are organized in my case?
The "problem" exists in all QS versions I have (the latest one is 3.1 SR1)
Looking forward to suggestions and comments.
Regards,
Vlad
- Mark as New
- Bookmark
- Subscribe
- Mute
- Subscribe to RSS Feed
- Permalink
- Report Inappropriate Content
It appears that Qlik has a limitation in the MapObject:
"In Qlik Sense 1.X map has a restriction of 1000 input values only. Up to version 3.X map the value increased to 3333"
https://help.qlik.com/en-US/sense/Subsystems/Hub/Content/Visualizations/Map/load-map-data.htm
It does not explain the reason why dots were displayed better in some cases above, but looks like there is no easy way around it.
I've got some additional information from Qlik about possible workarounds, so will be investigating it further.
Regards,
Vlad