Unlock a world of possibilities! Login now and discover the exclusive benefits awaiting you.
- Qlik Community
- :
- Forums
- :
- Analytics
- :
- App Development
- :
- Re: Problem displaying stdev() results across dime...
- Subscribe to RSS Feed
- Mark Topic as New
- Mark Topic as Read
- Float this Topic for Current User
- Bookmark
- Subscribe
- Mute
- Printer Friendly Page
- Mark as New
- Bookmark
- Subscribe
- Mute
- Subscribe to RSS Feed
- Permalink
- Report Inappropriate Content
Problem displaying stdev() results across dimensions in Qlik sense
Hello,
I'm using the following formula to compare outcomes in 2014 to the average outcome from 2008-2012 in terms of the standard deviation from 2008-2012.
(sum({$<YEAR= {'2014'}>}OUTCOME) - sum({$<YEAR= {'<2013'}>}OUTCOME)/5)
/
(stdev({$<YEAR= {'<2013'}>}aggr(sum({$<YEAR= {'<2013'}>}OUTCOME),YEAR))* sqrt(4/5))
I'm producing the result across a dimension for different areas. I've checked that each component of the formula is working correctly using the KPI tool and filtering to one area without any trouble.
The problem is that Qlik sense does not produce results in charts where multiple areas are being compared on this measure. For example, when I used area as the dimension in a bar chart and the above formula as the measure no results were produced. Similarly, in a scatter plot with area as the dimension, this measure for the x-axis, and another measure for the y, results for only one or two random areas are displayed or I get an error message saying there are no valid values to display.
Using the bar chart to diagnose the problem I commented out different parts of the formula above and the error only appeared when the stdev portion of the code was included:
stdev({$<YEAR= {'<2013'}>}aggr(sum({$<YEAR= {'<2013'}>}OUTCOME),YEAR))
Further when I changed this stdev function to the sum function the chart worked. I've seen the error on more than one computer. This leads me to think there may be a bug with the stdev function. Has anyone seen something similar?
Thanks in advance
Accepted Solutions
- Mark as New
- Bookmark
- Subscribe
- Mute
- Subscribe to RSS Feed
- Permalink
- Report Inappropriate Content
I found the solution! Total is not needed, but the aggregation needs to be across the dimension being controlled with the set analysis and the dimension being presented in the chart. That's it, and it working fine now. My updated formula is below.
stdev({$<YEAR= {'<2013'}>} aggr(sum({$<YEAR= {'<2013'}>}OUTCOME),YEAR,AREA))
- Mark as New
- Bookmark
- Subscribe
- Mute
- Subscribe to RSS Feed
- Permalink
- Report Inappropriate Content
Hi all,
I found that I need to include total in my formula to produce results across charts. I'm now getting results to appear in my chart but they are incorrect and the same across all of my dimension values. Here's my updated function:
stdev({$<YEAR= {'<2013'}>} total aggr(sum({$<YEAR= {'<2013'}>}OUTCOME),YEAR))
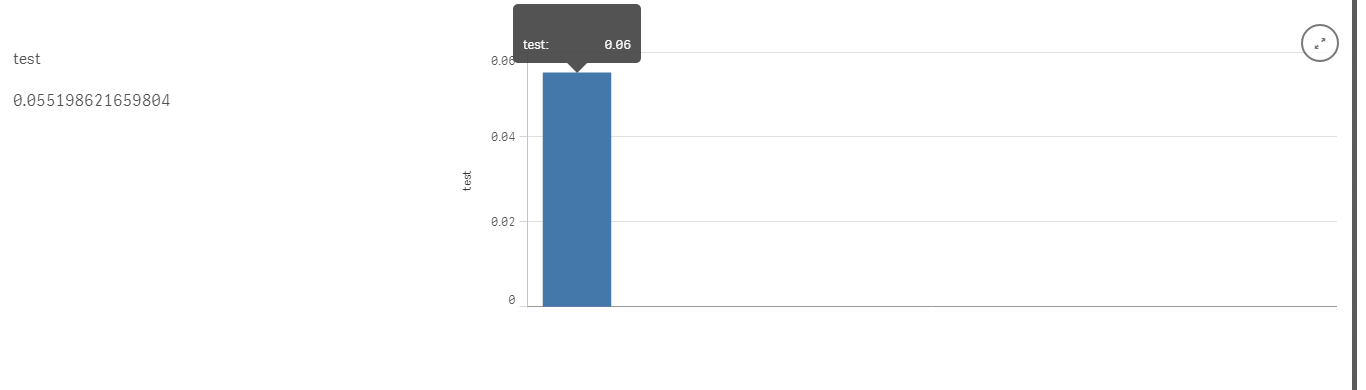
I've attached a screenshot that shows the bar chart using this function producing the same outcome for all areas. The text output on the left for the same function is correct, but the output for the selected bar in the chart is incorrect. In the second screenshot when that one area becomes the only selection the bar chart value recalculates correctly and aligns with the text value.
Is the total aggregating the result across the areas rather than separately for each area? Is there something else I can do to the formula to fix this?
Thanks
- Mark as New
- Bookmark
- Subscribe
- Mute
- Subscribe to RSS Feed
- Permalink
- Report Inappropriate Content
I found the solution! Total is not needed, but the aggregation needs to be across the dimension being controlled with the set analysis and the dimension being presented in the chart. That's it, and it working fine now. My updated formula is below.
stdev({$<YEAR= {'<2013'}>} aggr(sum({$<YEAR= {'<2013'}>}OUTCOME),YEAR,AREA))