Unlock a world of possibilities! Login now and discover the exclusive benefits awaiting you.
- Qlik Community
- :
- Forums
- :
- Analytics
- :
- App Development
- :
- Problem with displaying previous value in bar char...
- Subscribe to RSS Feed
- Mark Topic as New
- Mark Topic as Read
- Float this Topic for Current User
- Bookmark
- Subscribe
- Mute
- Printer Friendly Page
- Mark as New
- Bookmark
- Subscribe
- Mute
- Subscribe to RSS Feed
- Permalink
- Report Inappropriate Content
Problem with displaying previous value in bar chart
Hi,
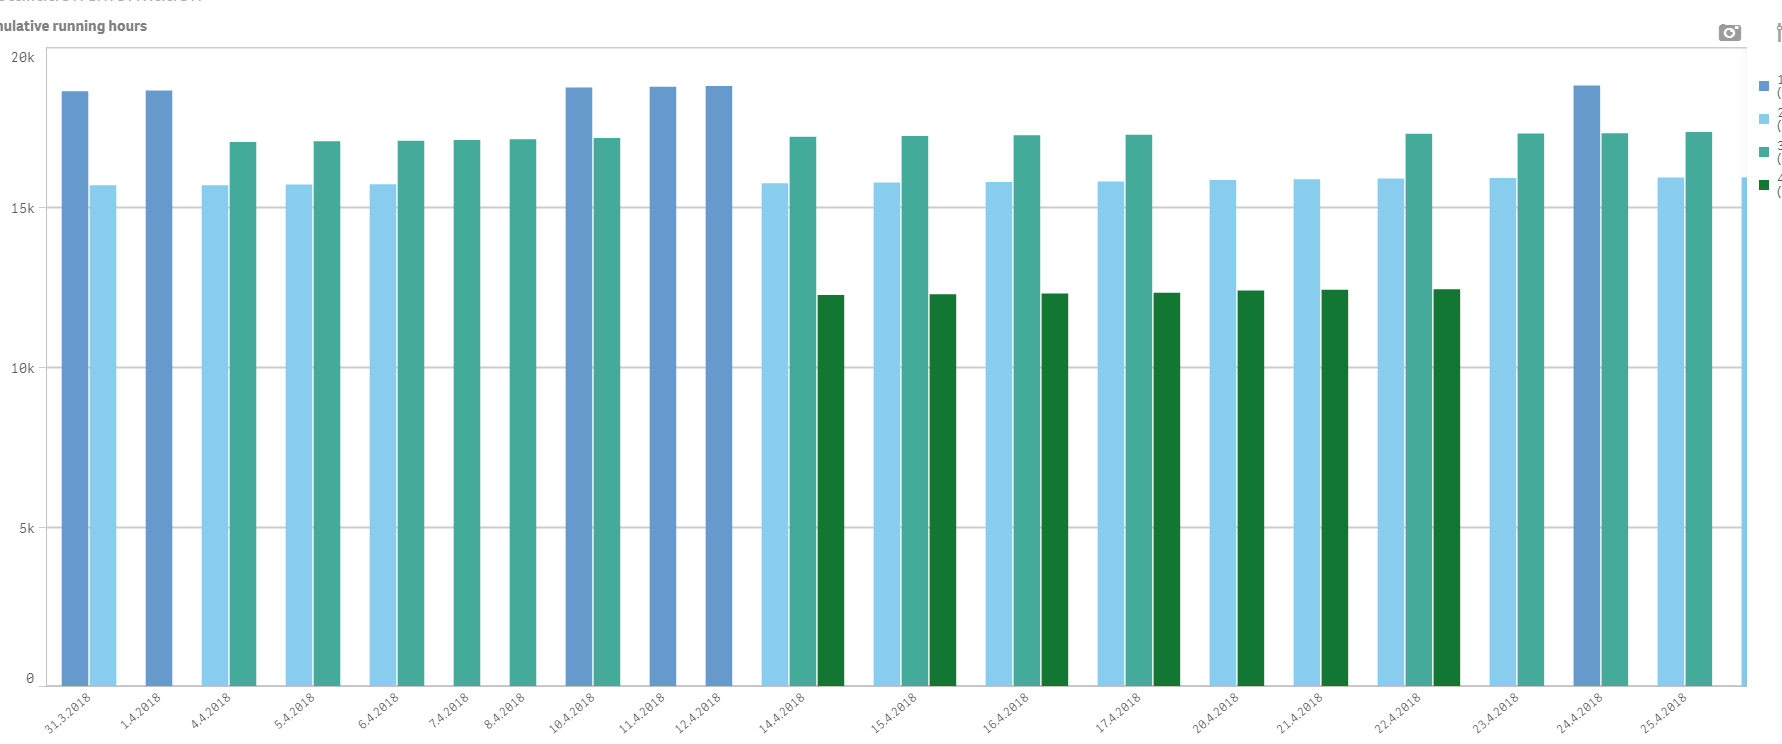
Theres an example below of the bar chart I have a problem with.
I have 2 dimensions (date and name) and an chart expression like below:
if(len(trim(Sum({1<
[Code] = {'xxxx'},
[Name] = P([Name]),
[%Key.Calendar]=P([%Key.Calendar])
>} Value)))=0
,above(total Sum({1<
[Code] = {'xxxx'},
[Name] = P([Name]),
[%Key.Calendar]=P([%Key.Calendar])
>} Value))
,Sum({1<
[Code] = {'xxxx'},
[Name] = P([Name]),
[%Key.Calendar]=P([%Key.Calendar])
>} Value))
What i'm trying to achieve is to use the previous data point of the series when there is no data for the current day. Looking at the chart, you can see that the blue bar has had data on the 31.3 and 1.4, but the bar is no longer visible on the 4.4 date because there is no data for that day, but it should display the 31.3 data because it hasn't changed. Can I achieve this with chart expressions? Or do I need to somehow do this on load scripts?
Br,
TL