Unlock a world of possibilities! Login now and discover the exclusive benefits awaiting you.
- Qlik Community
- :
- Forums
- :
- Analytics
- :
- App Development
- :
- Qlik Sense Line chart removing/understanding limit...
- Subscribe to RSS Feed
- Mark Topic as New
- Mark Topic as Read
- Float this Topic for Current User
- Bookmark
- Subscribe
- Mute
- Printer Friendly Page
- Mark as New
- Bookmark
- Subscribe
- Mute
- Subscribe to RSS Feed
- Permalink
- Report Inappropriate Content
Qlik Sense Line chart removing/understanding limitations
Hi all,
I'm new to qlik sense but very familiar with Qlikview. So finding my way!
My question is...
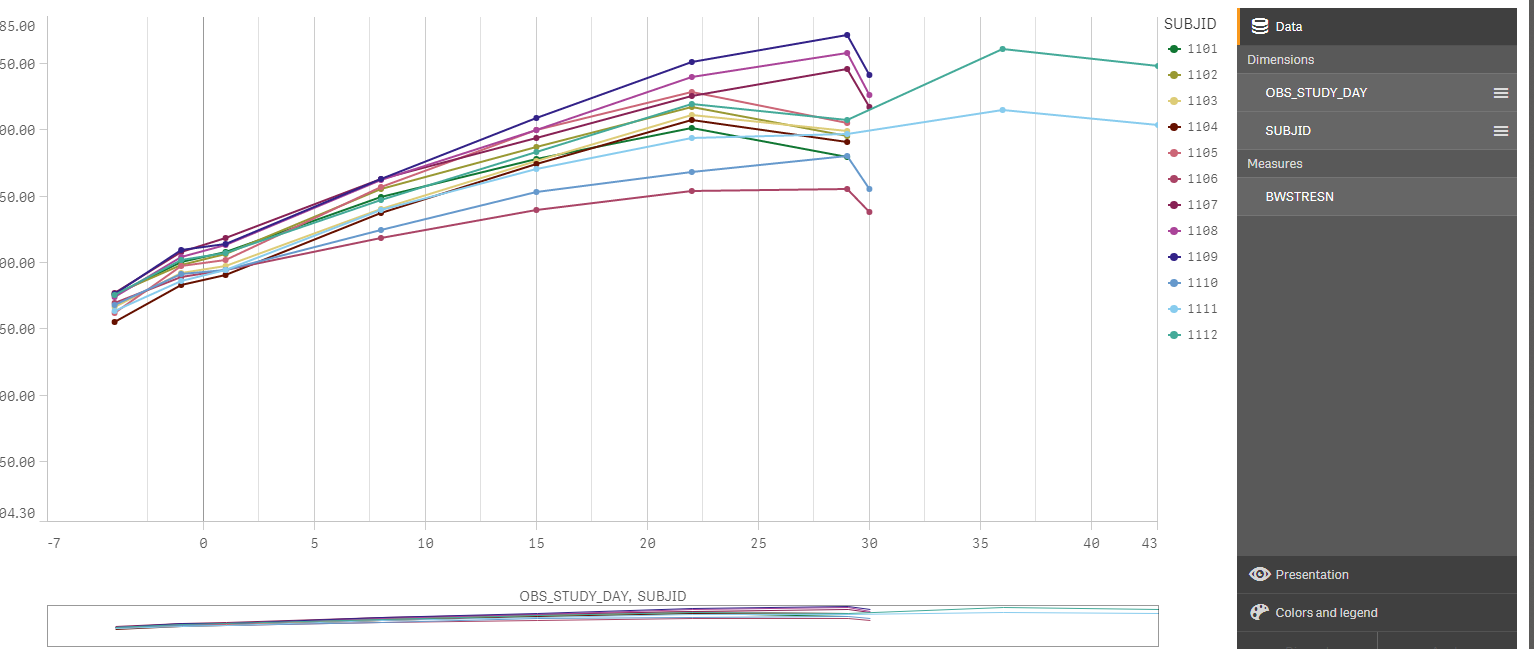
I am building a line chart of bodyweight change over time for a large number (60) of people.
My two dimensions are the day of the study, -7 through to 50; and SubjectID. The measure is simply the Bodyweight or I've tried Avg(Bodyweight).
The plot renders okay but there are only 10 or so lines visible and not the 60 or so I was hoping for.
I cant seem to find anything out about why this may be the case and how to get all the data to show.
Can someone help? Thanks! (screen shot below)
Mark
- Mark as New
- Bookmark
- Subscribe
- Mute
- Subscribe to RSS Feed
- Permalink
- Report Inappropriate Content
If you expand the Dimension do you have a limitation set?
- Mark as New
- Bookmark
- Subscribe
- Mute
- Subscribe to RSS Feed
- Permalink
- Report Inappropriate Content
Hi Mark,
No its set to No Limitation.
M