Unlock a world of possibilities! Login now and discover the exclusive benefits awaiting you.
- Qlik Community
- :
- Forums
- :
- Analytics
- :
- App Development
- :
- Qlik Sense - Rounding Inconsistencies of one formu...
- Subscribe to RSS Feed
- Mark Topic as New
- Mark Topic as Read
- Float this Topic for Current User
- Bookmark
- Subscribe
- Mute
- Printer Friendly Page
- Mark as New
- Bookmark
- Subscribe
- Mute
- Subscribe to RSS Feed
- Permalink
- Report Inappropriate Content
Qlik Sense - Rounding Inconsistencies of one formula in different places in the chart
Hello Qlik Community!
I come to you with a question about rounding in Qlik.
I've read the previous posts on the topic, explaining that 0.8 =/= 1.0 - 0.2 and why those inconsistencies are happening.
However, I think my situation is a bit different.
I have a bar chart and a set of measures.
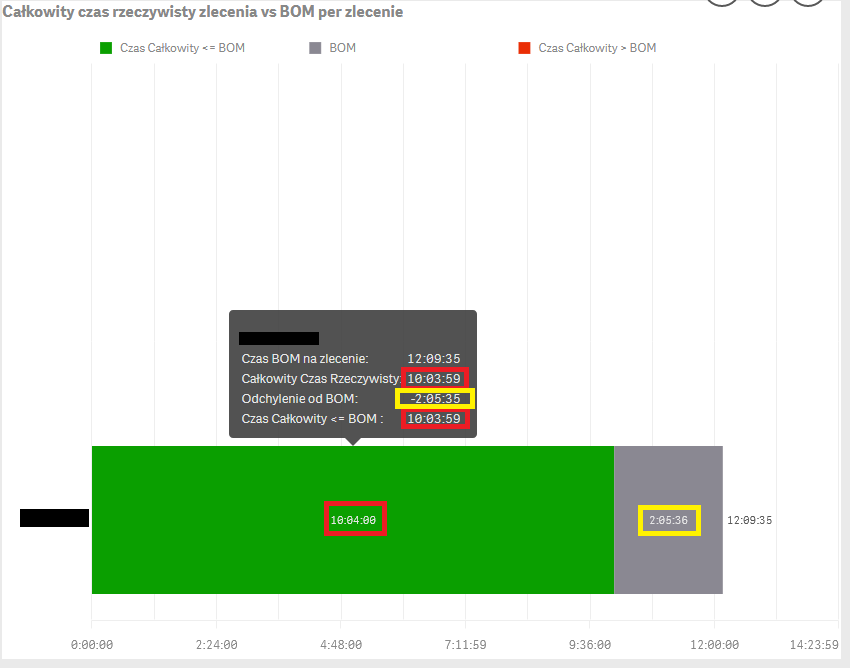
Those measures when put as the bars on the chart have a different value than what I get when I put them in hoverlabel (as I need it customized) they return slightly different values.
As you can see on the attached pics, the differences are very small, but they do exist for a significant portion of data.
Do you know what could be the problem? Why could it happen and what would be the fix?
(I hope you can guide me without me sharing my data, as I am unable to do so.)
The examples of codes for measures with that happening are:
1.
if
(
Avg(CZAS_NA_1_SZT_SEK)
<=
Avg(CZAS_BOM_NA_1_SZT_SEK)
,
Round(Avg(CZAS_NA_1_SZT_SEK))/86400
)
2.
if
(
//Round(Avg(CZAS_NA_1_SZT_SEK))
Avg(CZAS_NA_1_SZT_SEK)
<
Avg(CZAS_BOM_NA_1_SZT_SEK)
,
Round
(
Avg(CZAS_BOM_NA_1_SZT_SEK)
-
Avg(CZAS_NA_1_SZT_SEK)
)
/86400
,
Round(Avg(CZAS_BOM_NA_1_SZT_SEK))/86400
)
3.
if
(
Avg(SUMA_CZASU_ZLECENIE)
>
Avg(ILOSC_PW)*Avg(CZAS_BOM_NA_1_SZT_SEK)
,
Round
(
Avg(SUMA_CZASU_ZLECENIE)
-
Avg(ILOSC_PW)*Avg(CZAS_BOM_NA_1_SZT_SEK)
)
/86400
)
- Subscribe by Topic:
-
barchart
-
calculation
-
Chart
-
data labels
-
hover
-
maths
-
rounding
-
Rounding value Issue