Unlock a world of possibilities! Login now and discover the exclusive benefits awaiting you.
- Qlik Community
- :
- Forums
- :
- Analytics
- :
- App Development
- :
- Re: Qlik Sense: Why does this field need to be in ...
- Subscribe to RSS Feed
- Mark Topic as New
- Mark Topic as Read
- Float this Topic for Current User
- Bookmark
- Subscribe
- Mute
- Printer Friendly Page
- Mark as New
- Bookmark
- Subscribe
- Mute
- Subscribe to RSS Feed
- Permalink
- Report Inappropriate Content
Qlik Sense: Why does this field need to be in the load script to function as expected?
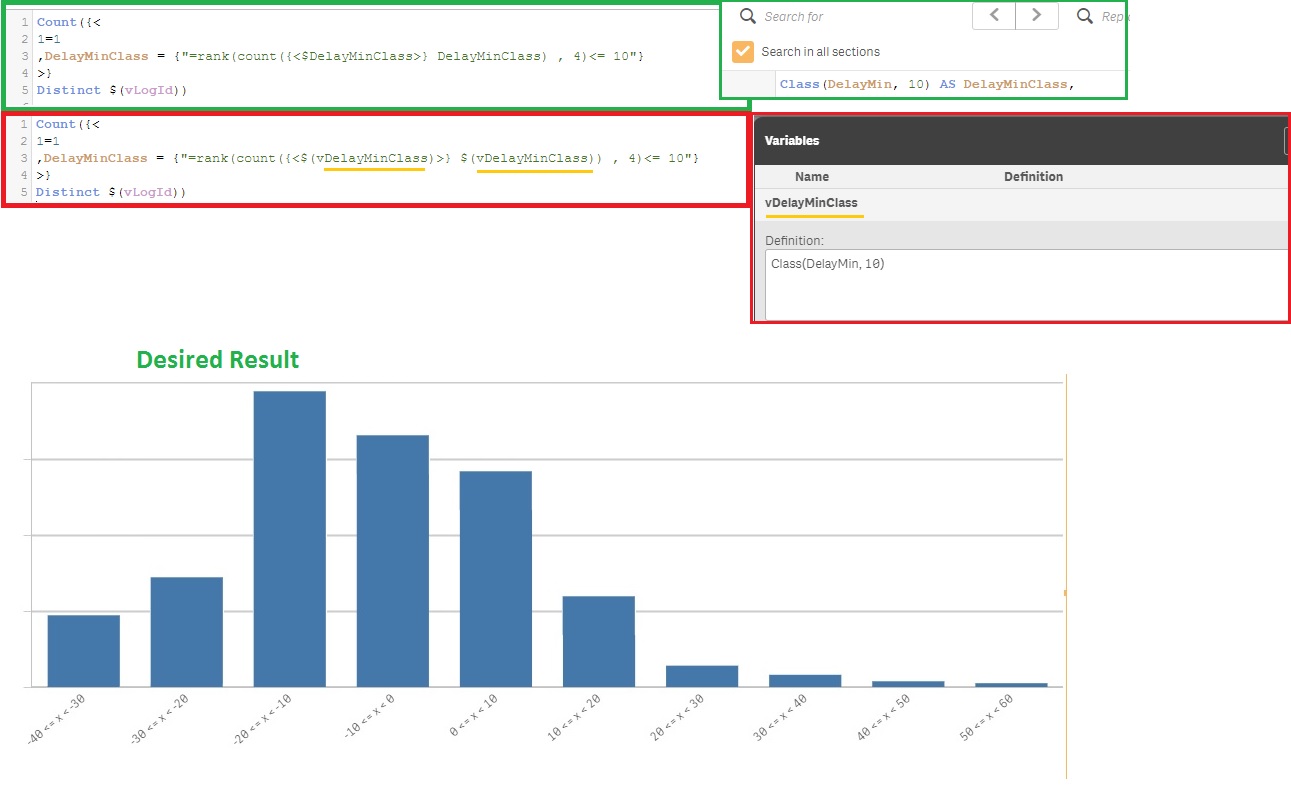
I have a bar chart where I am trying to visualize delays by minute group of X minutes given exact minute delays. Initially I decided to use the following formula Class(DelayMin, 10). I placed this formula in an application variable so I could tweak the X value (currently 10 minute grouping) with out reloading the data until I got the desired representation. I tried dozens of iterations and I always got 0 counts returned from my set analysis. However, if I took the same formula and plugged it into my load script everything works like a charm. I suspect this has to do with the order of operations where the class function must fire first to be used but I am not sure how to force the desired action inside the set analysis. This type of issue happens to me regularly and I usually try for a few hours and resort to putting my variables in the load script but I really don’t like the idea of doing something because that is the only way I know how… I have attached a image that shows the example in more detail.
- Mark as New
- Bookmark
- Subscribe
- Mute
- Subscribe to RSS Feed
- Permalink
- Report Inappropriate Content
Still have not figured this out so any information would be greatly appreciated! Thanks
- Mark as New
- Bookmark
- Subscribe
- Mute
- Subscribe to RSS Feed
- Permalink
- Report Inappropriate Content
It does sound like it's not updating the variable after the script has been loaded.
Have you tried using a Dynamic Update button?