Unlock a world of possibilities! Login now and discover the exclusive benefits awaiting you.
- Qlik Community
- :
- Forums
- :
- Analytics
- :
- App Development
- :
- Re: Qlik Sense rolling months with YearMonth selec...
- Subscribe to RSS Feed
- Mark Topic as New
- Mark Topic as Read
- Float this Topic for Current User
- Bookmark
- Subscribe
- Mute
- Printer Friendly Page
- Mark as New
- Bookmark
- Subscribe
- Mute
- Subscribe to RSS Feed
- Permalink
- Report Inappropriate Content
Qlik Sense rolling months with YearMonth selection
Hello,
I have troubles to implement 12 months rolling sum graphs in Qlik Sense. I have created the as-of table as described in this link: https://community.qlik.com/blogs/qlikviewdesignblog/2015/11/02/the-as-of-table . Rolling period calculation is also as in that guide: dimension: AsOfMonth, measure: Sum({$<MonthDiff={"<12"}>} Sales).
I get desired graph by selecting 12 months from AsOfMonth filter pane: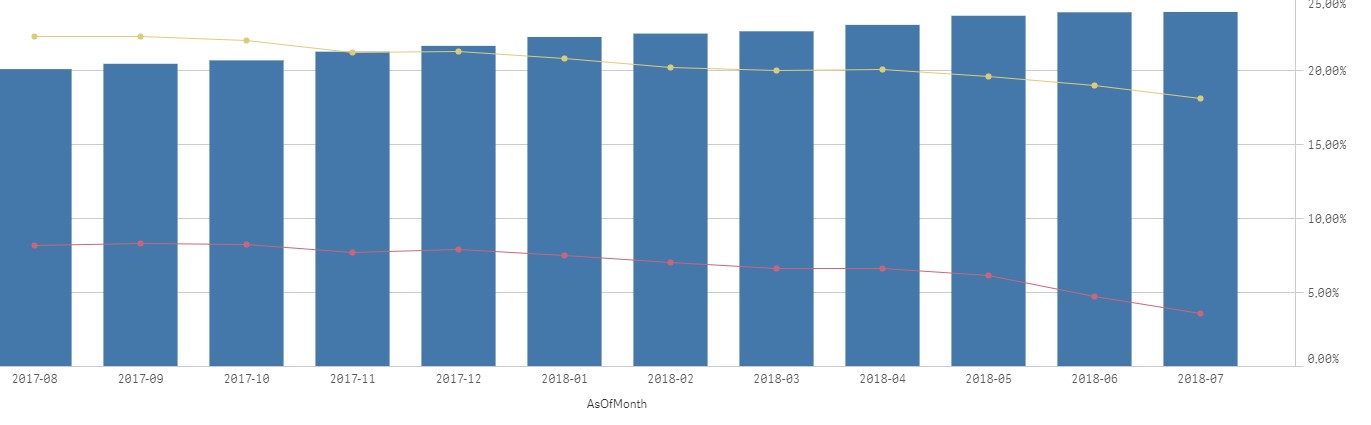
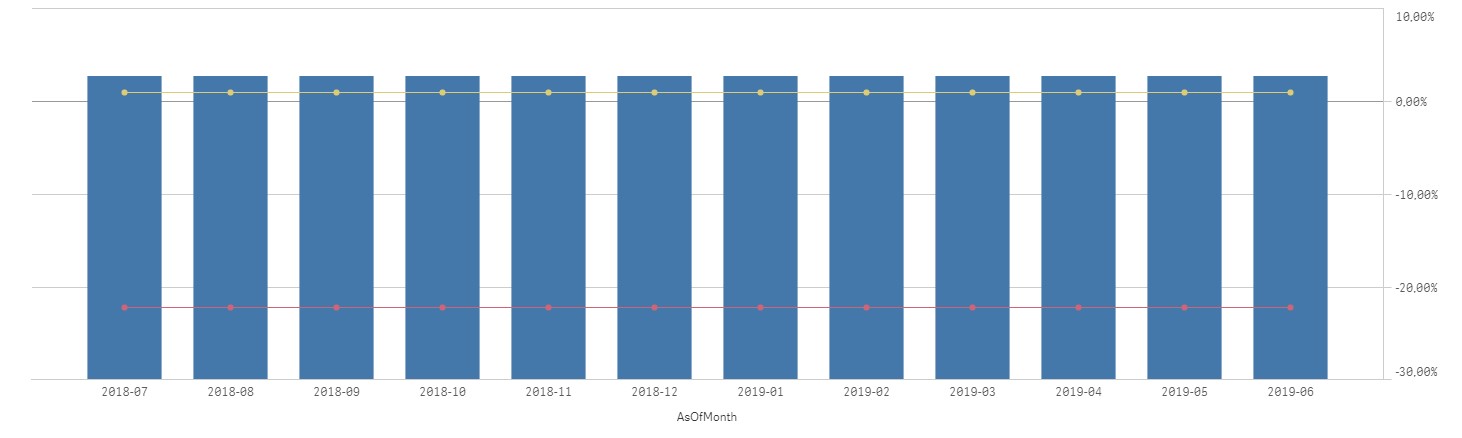
The problem is, the whole app is designed to be used by selecting single month from the YearMonth-filter. When I make that selection, the graph looks like this:
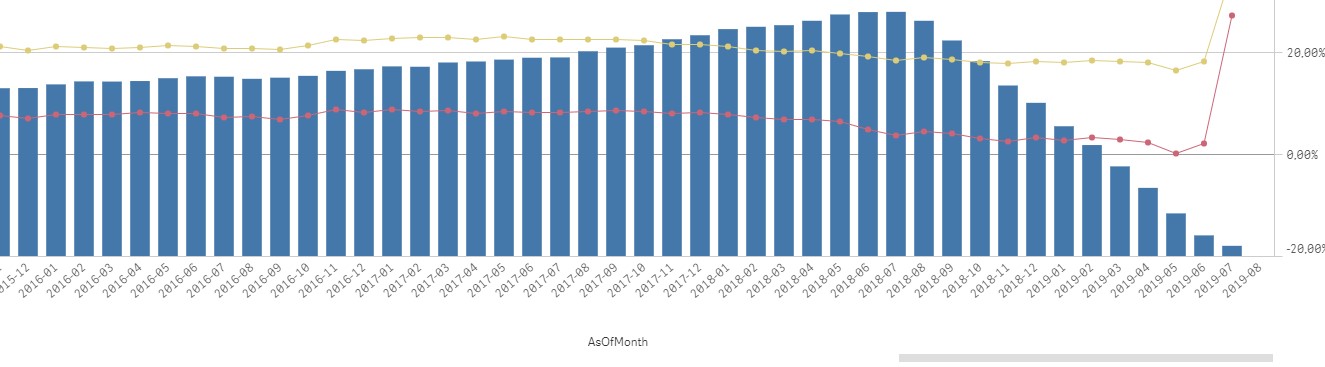
Without any filters, the visual looks like this:
I would be grateful for any help. Thank you.
- Mark as New
- Bookmark
- Subscribe
- Mute
- Subscribe to RSS Feed
- Permalink
- Report Inappropriate Content
May be use these expressions:
- Mark as New
- Bookmark
- Subscribe
- Mute
- Subscribe to RSS Feed
- Permalink
- Report Inappropriate Content
Try your expression like this:
num(Avg({<Month_Year>}Aggr(((Sum({<Month_Year = {"=Date#(Only({1} Month_Year), 'MMM-YYYY') >= AddMonths(Max(TOTAL Date#(Month_Year, 'MMM-YYYY')), -12) and Date#(Only({1} Month_Year), 'MMM-YYYY') <= Max(TOTAL Date#(Month_Year, 'MMM-YYYY'))"}>}a/b))*Only({<Month_Year>} c)), empid, Month_Year)
),'#.##')
- Mark as New
- Bookmark
- Subscribe
- Mute
- Subscribe to RSS Feed
- Permalink
- Report Inappropriate Content
Thank you for your response.
Can't get it work though. What are 'a/b' and 'c' in your example? And also 'empid' seems to be unrecognized function.