Unlock a world of possibilities! Login now and discover the exclusive benefits awaiting you.
- Qlik Community
- :
- Forums
- :
- Analytics
- :
- App Development
- :
- Replicating table "Totals" in KPI
- Subscribe to RSS Feed
- Mark Topic as New
- Mark Topic as Read
- Float this Topic for Current User
- Bookmark
- Subscribe
- Mute
- Printer Friendly Page
- Mark as New
- Bookmark
- Subscribe
- Mute
- Subscribe to RSS Feed
- Permalink
- Report Inappropriate Content
Replicating table "Totals" in KPI
Hello Everyone,
I am having issues replicating the sum from the "Totals" section of a table visualization into a KPI. The "Total" defaults to the value I keep getting in the KPI, but I am trying to get the value I get when I change the Totals function to "sum". I am counting distinct users (user_id) over a particular dimension (segment_id). The KPI keeps returning the distinct count across all the segment_id's, so if someone was in multiple, in only counts them once. The visualization sums per segment_id, so I get the desired total. I am pretty sure a pretty basic AGGR should solve this, but I can't get it to work. Here is the measure I am using for the user_id count:
count({<TestType={2}>} distinct user_id)
I tried this and it gives me the same output:
aggr(count({<TestType={2}>}total distinct user_id),segment_id)
I appreciate any help.
Thanks,
Ben
- Mark as New
- Bookmark
- Subscribe
- Mute
- Subscribe to RSS Feed
- Permalink
- Report Inappropriate Content
- Mark as New
- Bookmark
- Subscribe
- Mute
- Subscribe to RSS Feed
- Permalink
- Report Inappropriate Content
Thank you for the swift reply!
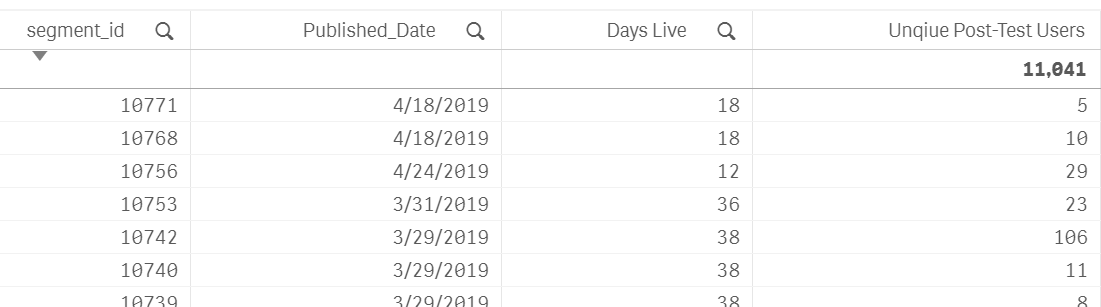
I believe this may have summed the actual values instead of the counts. I attached a pic of my visualization (and just noticed I spelled "unique" wrong). Disregarding the middle 2 fields, you can see the counts by segment_id. A user could be across all of these, and I need the 11,041 to show up in the KPI. I keep getting ~5400 since it is giving me unique across the board, and not summing the totals like the visualization is. The formula you sent is giving me ~1.2 million, which is why I think it is summing the values (segment_id?).
Thanks,
Ben