Unlock a world of possibilities! Login now and discover the exclusive benefits awaiting you.
- Qlik Community
- :
- Forums
- :
- Analytics
- :
- App Development
- :
- Re: Rolling N Month in Pivot Table
- Subscribe to RSS Feed
- Mark Topic as New
- Mark Topic as Read
- Float this Topic for Current User
- Bookmark
- Subscribe
- Mute
- Printer Friendly Page
- Mark as New
- Bookmark
- Subscribe
- Mute
- Subscribe to RSS Feed
- Permalink
- Report Inappropriate Content
Rolling N Month in Pivot Table
Hi All,
I have a pivot table with two Rows dimensions and Month-Year as column dimension.
I need the formula avg(score) in expression will display the result of rolling three month for each month.
Means for January 2018 it should show result for Nov 17, Dec 17 and Jan 18.
I red about rengesum and rangeaverage but it seems working in straight table but not pivot.
Any thoughts please?
Accepted Solutions
- Mark as New
- Bookmark
- Subscribe
- Mute
- Subscribe to RSS Feed
- Permalink
- Report Inappropriate Content
- Mark as New
- Bookmark
- Subscribe
- Mute
- Subscribe to RSS Feed
- Permalink
- Report Inappropriate Content
We have the same question.. We work with Rolling Months, Rolling Quarters, Rolling Years.
Would love to get some help on this type of question. this is
Another is about MASTER Calendar...
- Mark as New
- Bookmark
- Subscribe
- Mute
- Subscribe to RSS Feed
- Permalink
- Report Inappropriate Content
can you sort the month in ascending order and use something similar to
rangeavg(above(total avg(score),0,3))
- Mark as New
- Bookmark
- Subscribe
- Mute
- Subscribe to RSS Feed
- Permalink
- Report Inappropriate Content
Thanks For replay Pradosh
But what about two dimensions in Rows?
See my table screenshot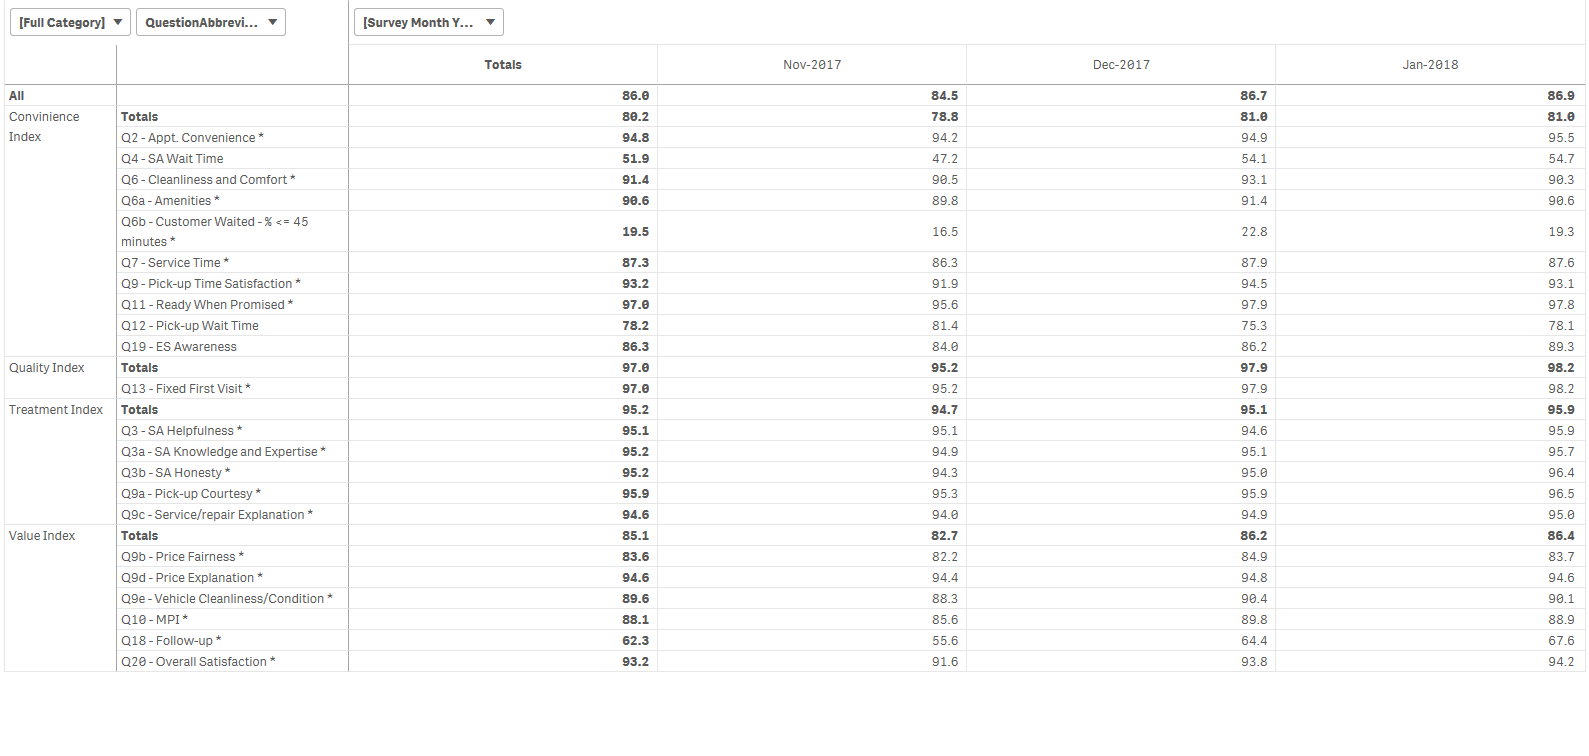
- Mark as New
- Bookmark
- Subscribe
- Mute
- Subscribe to RSS Feed
- Permalink
- Report Inappropriate Content
Is it working ? Not sure i follow what you want to say here.
- Mark as New
- Bookmark
- Subscribe
- Mute
- Subscribe to RSS Feed
- Permalink
- Report Inappropriate Content
No it is not.
It does not give the correct result.
- Mark as New
- Bookmark
- Subscribe
- Mute
- Subscribe to RSS Feed
- Permalink
- Report Inappropriate Content
- Mark as New
- Bookmark
- Subscribe
- Mute
- Subscribe to RSS Feed
- Permalink
- Report Inappropriate Content
No,
Let me take a look at this.
Thanks.
- Mark as New
- Bookmark
- Subscribe
- Mute
- Subscribe to RSS Feed
- Permalink
- Report Inappropriate Content
That is very helpful.
It seems working.
I will confirm as soon as I check all calculation
Thanks