Unlock a world of possibilities! Login now and discover the exclusive benefits awaiting you.
- Qlik Community
- :
- Forums
- :
- Analytics
- :
- App Development
- :
- Re: SALES REPORT: TOP CUSTOMERS
- Subscribe to RSS Feed
- Mark Topic as New
- Mark Topic as Read
- Float this Topic for Current User
- Bookmark
- Subscribe
- Mute
- Printer Friendly Page
- Mark as New
- Bookmark
- Subscribe
- Mute
- Subscribe to RSS Feed
- Permalink
- Report Inappropriate Content
SALES REPORT: TOP CUSTOMERS
hey evryone short questiion regarding a sale report , how do i present my top customers and my wickest customers?
- « Previous Replies
-
- 1
- 2
- Next Replies »
Accepted Solutions
- Mark as New
- Bookmark
- Subscribe
- Mute
- Subscribe to RSS Feed
- Permalink
- Report Inappropriate Content
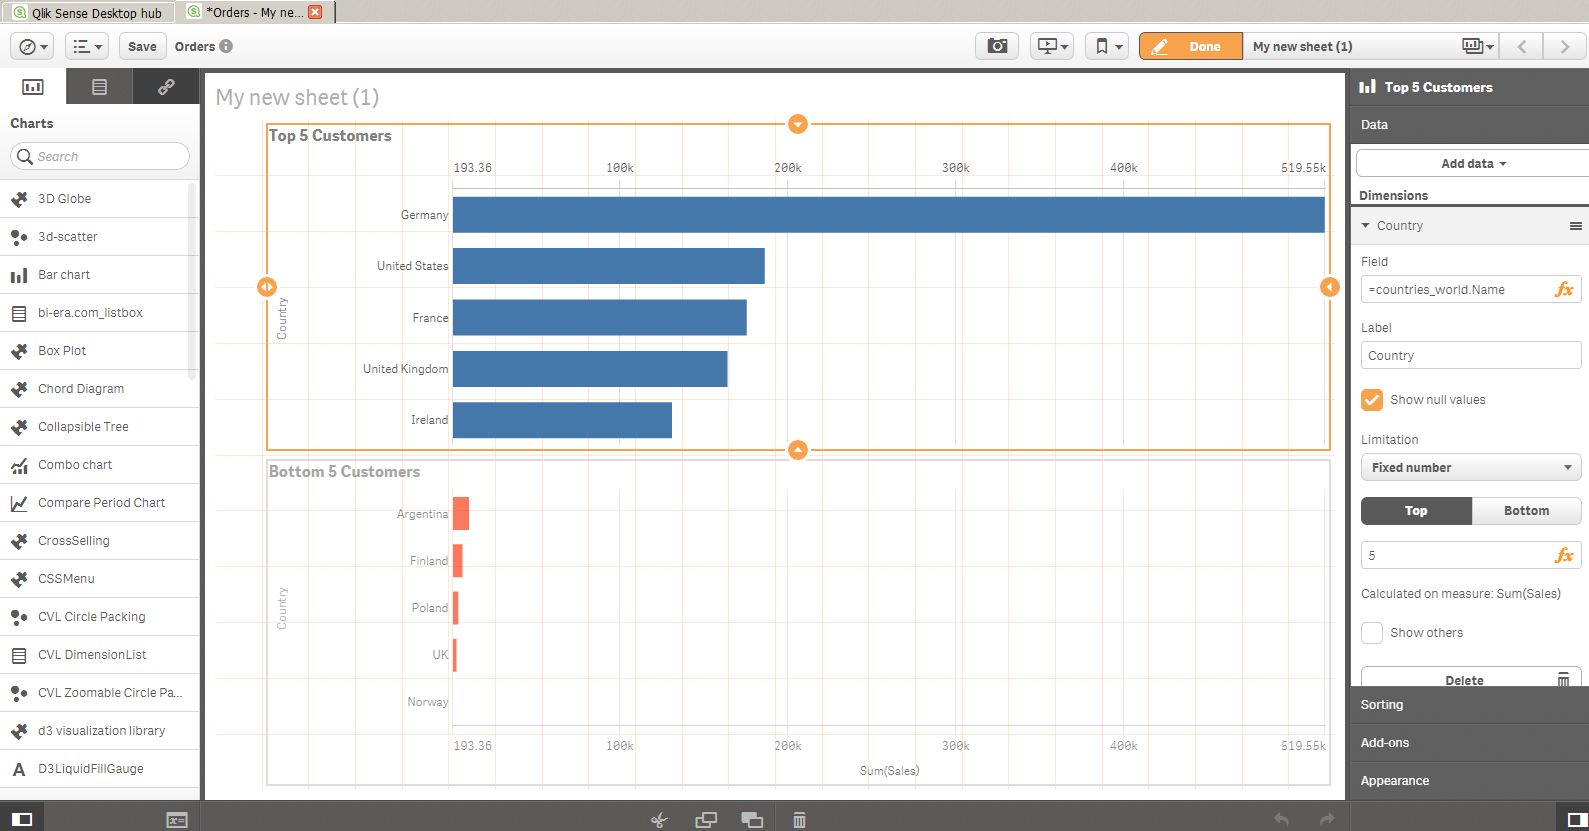
Have a look a the following. 2 horizontal bars. One with top 5 and other with bottom 5
i made the min/max of the axis the same.
The measure is sum(Sales) so the max is the maximum value by customer (i have country)
Max( total aggr( sum(Sales), country) )
and the min is similar
Max( total aggr( sum(Sales), country) )
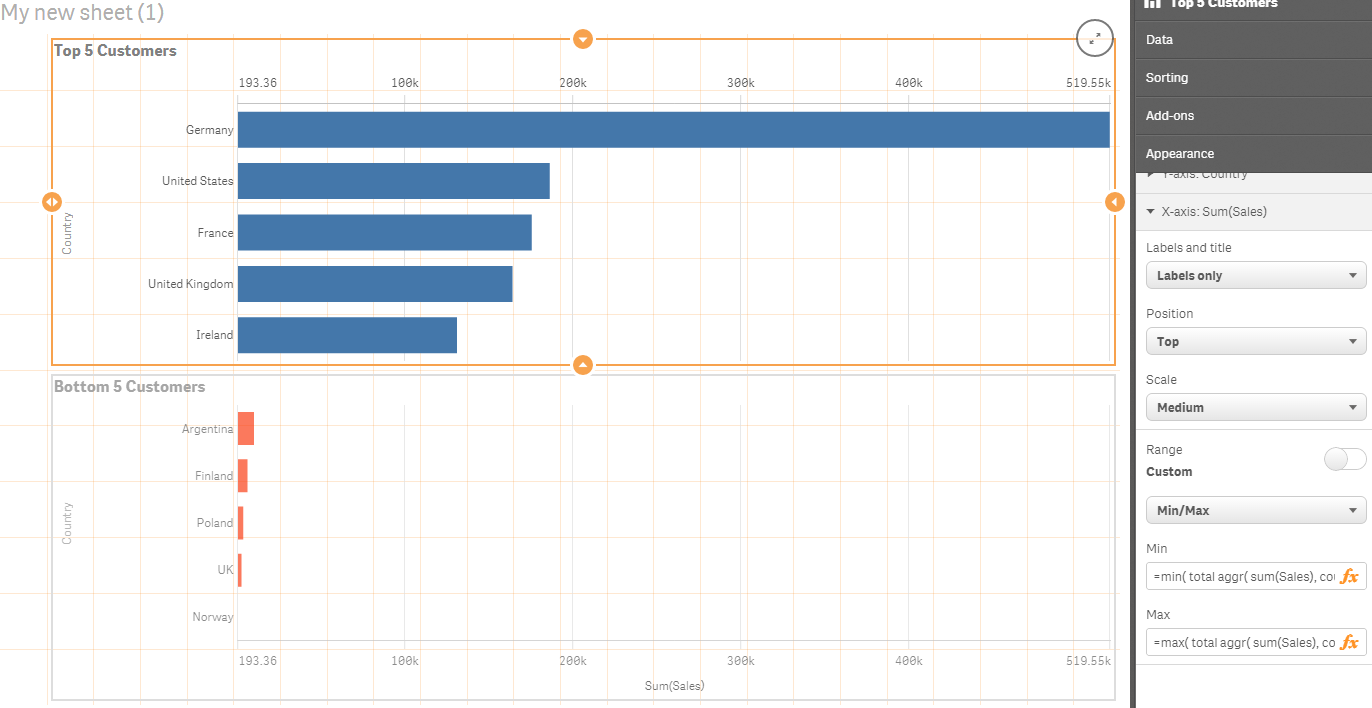
i also moved the axis on the top bar to the top and changed the colors
I think its a decent approach to show the top/bottom 5
- Mark as New
- Bookmark
- Subscribe
- Mute
- Subscribe to RSS Feed
- Permalink
- Report Inappropriate Content
Hi Jhonatan,
A scatter plot would be the best way to show it. It would be very easy to pic the outlays.
You can even go with colour coding (RAG status) to give a better visual appearance.
- Mark as New
- Bookmark
- Subscribe
- Mute
- Subscribe to RSS Feed
- Permalink
- Report Inappropriate Content
Have a look a the following. 2 horizontal bars. One with top 5 and other with bottom 5
i made the min/max of the axis the same.
The measure is sum(Sales) so the max is the maximum value by customer (i have country)
Max( total aggr( sum(Sales), country) )
and the min is similar
Max( total aggr( sum(Sales), country) )
i also moved the axis on the top bar to the top and changed the colors
I think its a decent approach to show the top/bottom 5
- Mark as New
- Bookmark
- Subscribe
- Mute
- Subscribe to RSS Feed
- Permalink
- Report Inappropriate Content
i did it and got this....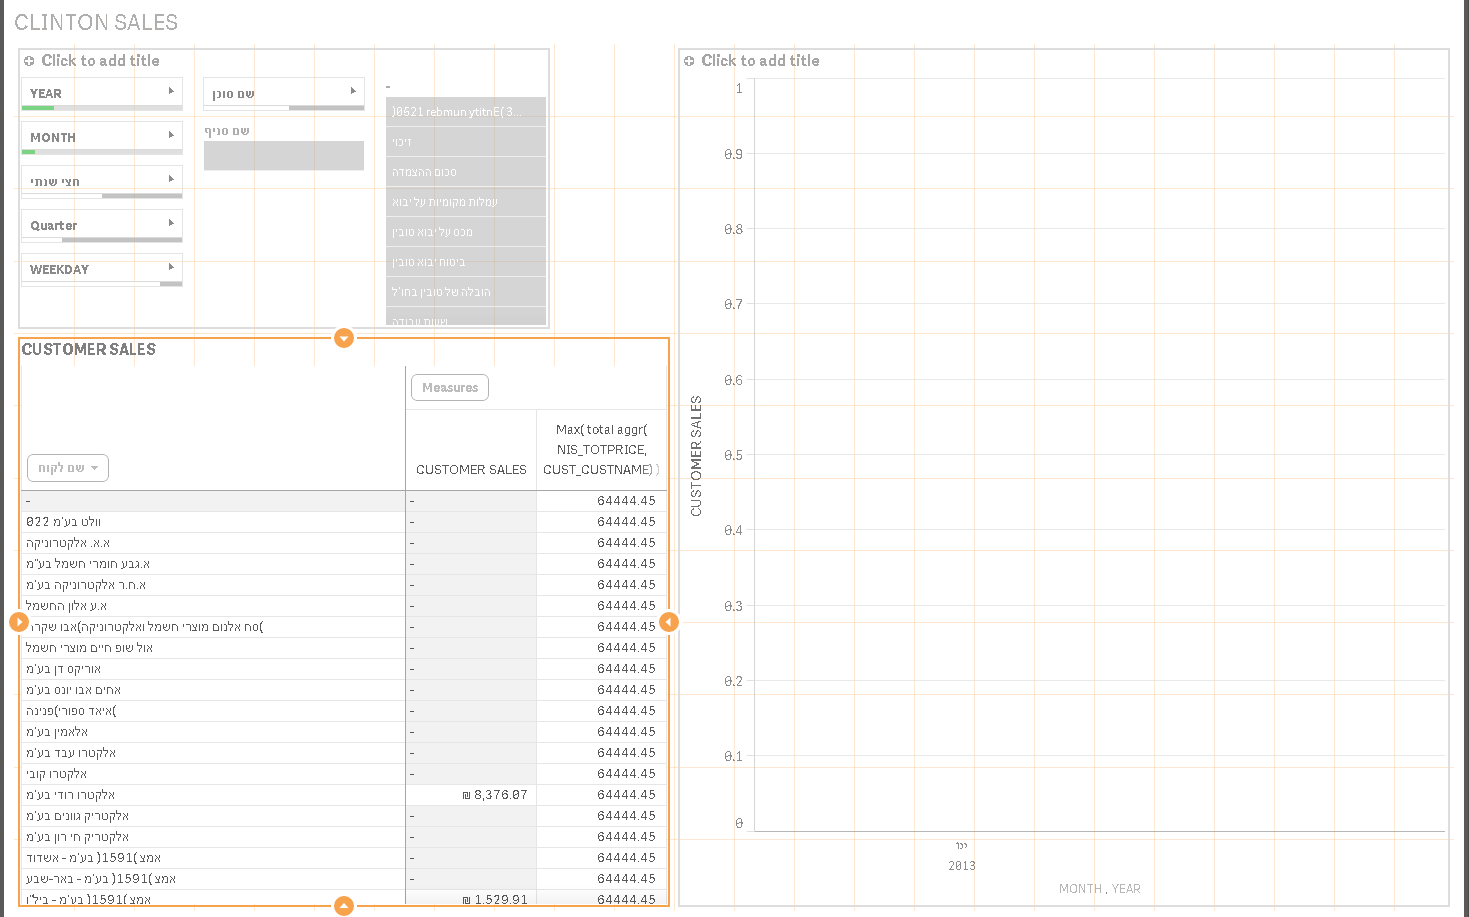
- Mark as New
- Bookmark
- Subscribe
- Mute
- Subscribe to RSS Feed
- Permalink
- Report Inappropriate Content
Max( total aggr( NIS_TOTPRICE, CUST_CUSTNAME) )
- Mark as New
- Bookmark
- Subscribe
- Mute
- Subscribe to RSS Feed
- Permalink
- Report Inappropriate Content
The expression is syntactically.incorrect. The first argument for the aggr () function is a chart aggregation function like sum()
Example:
Max( total aggr( sum(NIS_TOTPRICE), CUST_CUSTNAME))
- Mark as New
- Bookmark
- Subscribe
- Mute
- Subscribe to RSS Feed
- Permalink
- Report Inappropriate Content
i don't see where are u placing this expression....
- Mark as New
- Bookmark
- Subscribe
- Mute
- Subscribe to RSS Feed
- Permalink
- Report Inappropriate Content
Take a look at the bottom right part of my 2nd screenshot above. I'm.using it to.define a min or max on the X axis scale. That way the scales for both apps line up and it's useful to see how far apart the.top.customers.are.from the bottom.customers.
- Mark as New
- Bookmark
- Subscribe
- Mute
- Subscribe to RSS Feed
- Permalink
- Report Inappropriate Content
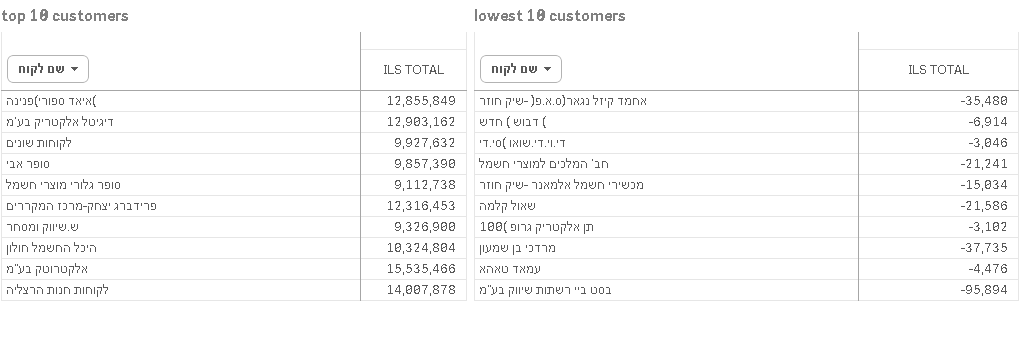
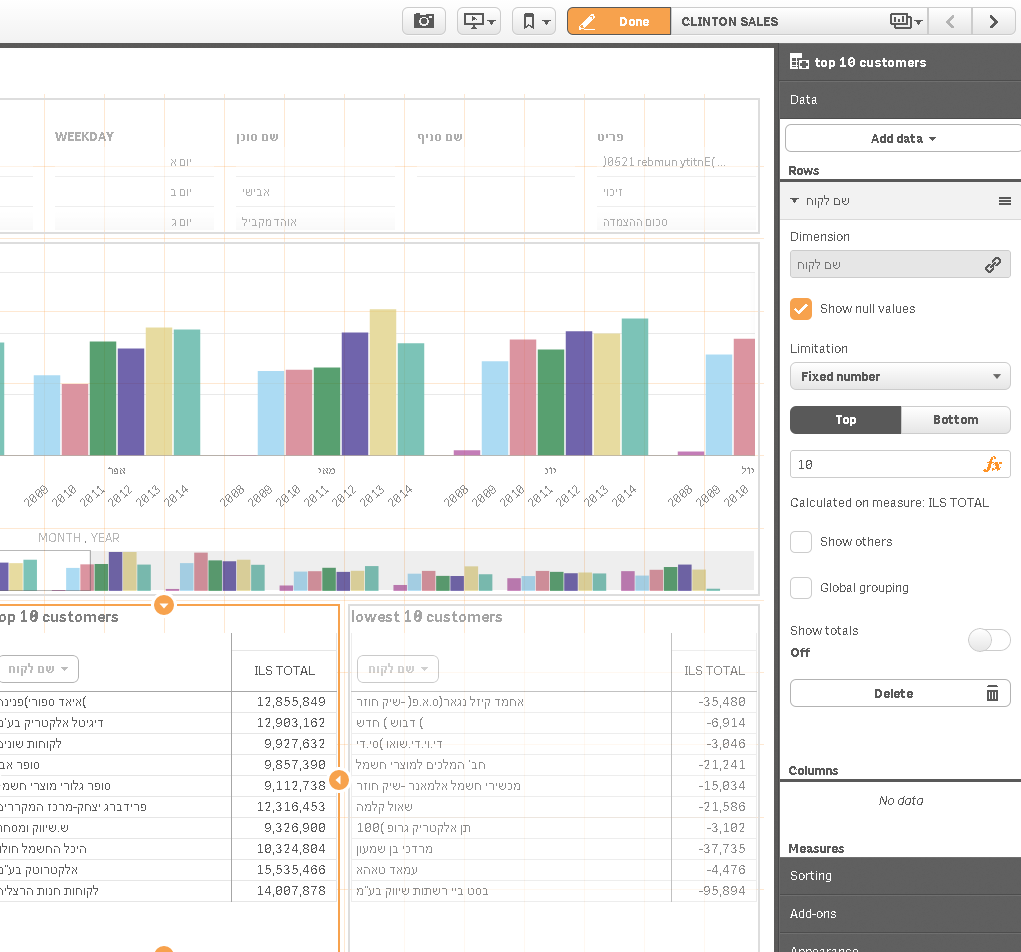
Hey i used your suggestion and i am getting a table with 10 customers,
but still no getting the top/lowest ....
- Mark as New
- Bookmark
- Subscribe
- Mute
- Subscribe to RSS Feed
- Permalink
- Report Inappropriate Content
It LOOKS like you are getting both top 10 and bottom 10 in the tables. Perhaps you want to hit the 'Sorting' property on the right to ensure you are sorting by ILS Total ? To me it looks like only the sort is missing.
- « Previous Replies
-
- 1
- 2
- Next Replies »