Unlock a world of possibilities! Login now and discover the exclusive benefits awaiting you.
- Qlik Community
- :
- Forums
- :
- Analytics
- :
- App Development
- :
- Re: Scale line chart with a date picker in Qlik Se...
- Subscribe to RSS Feed
- Mark Topic as New
- Mark Topic as Read
- Float this Topic for Current User
- Bookmark
- Subscribe
- Mute
- Printer Friendly Page
- Mark as New
- Bookmark
- Subscribe
- Mute
- Subscribe to RSS Feed
- Permalink
- Report Inappropriate Content
Scale line chart with a date picker in Qlik Sense
Hello everyone,
I'm new to Qlik Sense and I'm still fioguring out all the possibilities.
At the moment I have a lot of data, all with a timestamp from a 5 minute time bucket at a specific day. I want to print a line chart, which shows me the whole day at once, so I do not have to scroll horizontally.
Besides that I will be using data from weeks and months in the future, so I need some kind of a date picker, where I can pick a certain date and time intervall, to show me the specific data.
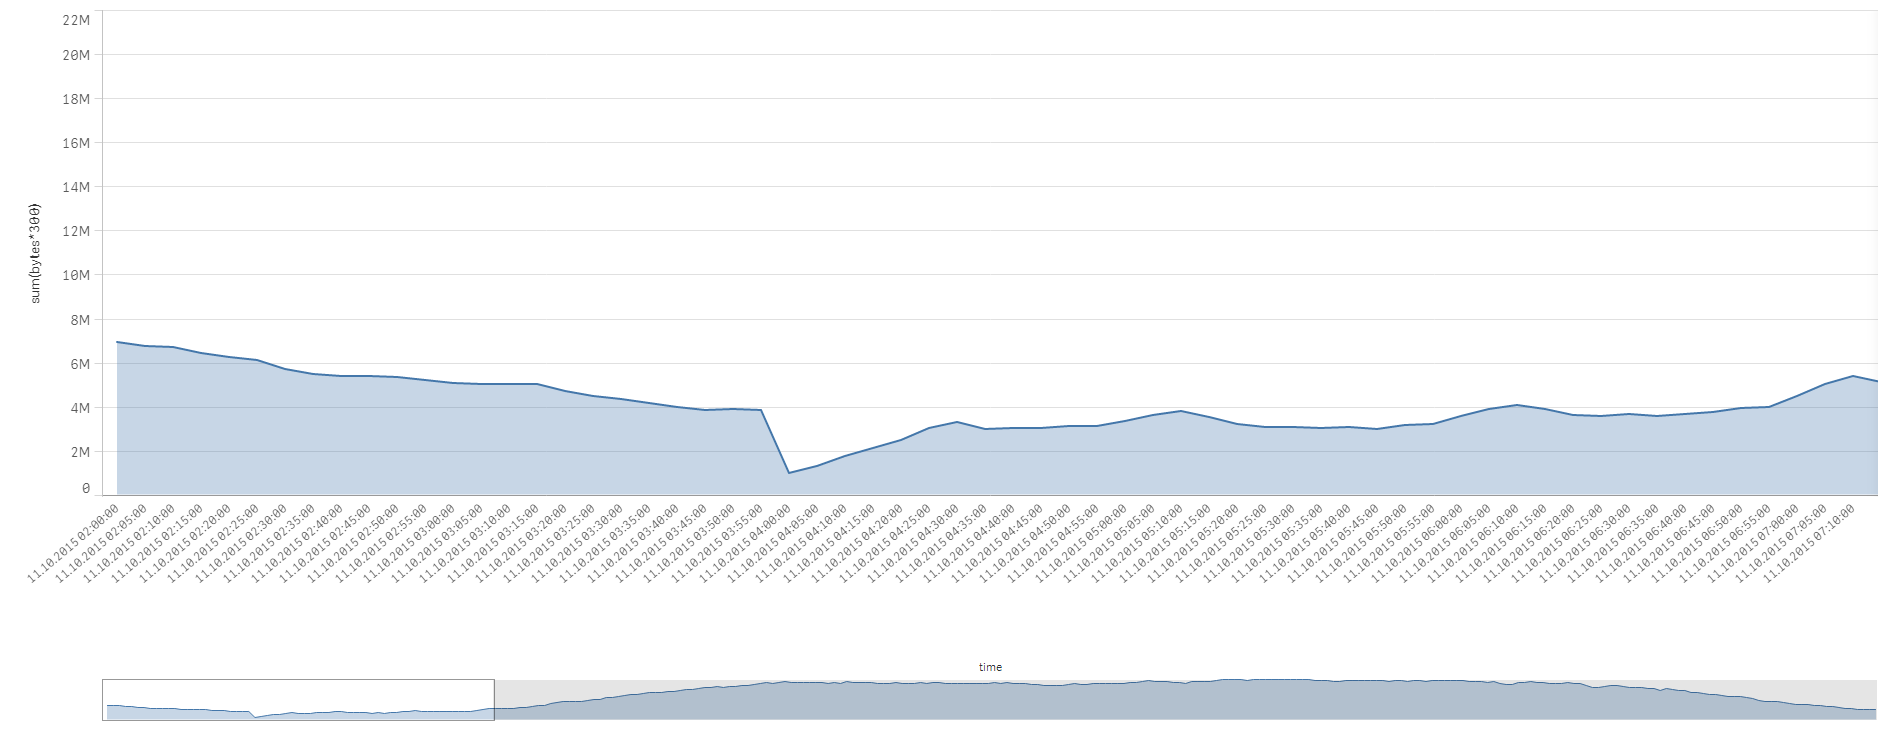
At the moment my chart looks like this. Do you guys have any idea, how I could fit all entries in the viewport (no scroll), kind of like a zoom?
Thank you a lot!
- Mark as New
- Bookmark
- Subscribe
- Mute
- Subscribe to RSS Feed
- Permalink
- Report Inappropriate Content