Unlock a world of possibilities! Login now and discover the exclusive benefits awaiting you.
- Qlik Community
- :
- Forums
- :
- Analytics
- :
- App Development
- :
- Selecting data from multiple Excel tables with sam...
- Subscribe to RSS Feed
- Mark Topic as New
- Mark Topic as Read
- Float this Topic for Current User
- Bookmark
- Subscribe
- Mute
- Printer Friendly Page
- Mark as New
- Bookmark
- Subscribe
- Mute
- Subscribe to RSS Feed
- Permalink
- Report Inappropriate Content
Selecting data from multiple Excel tables with same field names
Hi all,
I have multiple excel files (*.xslx) containing data gathered over different dates. The excel files have the same sheet names and the same field names. The only data that is different from one file to another is the values of the fields.
Sample_File_Date1 :
Feature_Name Value_1 Value_2
4D TRAK 98% 75%
Automatic Coil Selection\AcsFcc 81% 65%
MRE 93% 40%
PCA 96% 21%
Sample_File_Date2 :
Feature_Name Value_1 Value_2
4D TRAK 94% 85%
Automatic Coil Selection\AcsFcc 82% 21%
MRE 0% 40%
PCA 67% 22%
In my load script, I am loading the excel files dynamically as below :
LOAD
Feature_Name
Value_1
Value_2
FROM [lib://../Sample_File_*.xlsx]
(ooxml, embedded labels, table is [SampleSheet]);
The problem I have is I have to display/calculate values based on the dates. That is, some of my charts use, for example, average of Value_1 only from the file Sample_File_Date2 , while elsewhere a pivot table might have to display the fields only from Sample_File_Date1 in a pivot table. What function(s) should I use to achieve this?
Any help is truly appreciated.
Regards,
Kanchana
- Tags:
- excel load
- qlik sense
- « Previous Replies
-
- 1
- 2
- Next Replies »
- Mark as New
- Bookmark
- Subscribe
- Mute
- Subscribe to RSS Feed
- Permalink
- Report Inappropriate Content
Hi Stefan,
I do not need to worry if the values are the same or not, the requirement is simply that I display the values as they are, but only from the latest results (that is why I calculate the MaxDate). In addition, I also need perform some more calculations based on the date, such as compare the values from the latest report with those from the last report, determine averages etc.
I think I cannot use Concat() because I need to display only one value in a pivot table. Just for the sake of simplicity of understanding, assume I have to load all the excel files, but display the data values (as is) only for the latest file in a pivot table.
Regards,
Kanchana
- Mark as New
- Bookmark
- Subscribe
- Mute
- Subscribe to RSS Feed
- Permalink
- Report Inappropriate Content
Hi Prashanth,
Yes, that's exactly what I want to do - to establish a relationship between the data in the excel sheets and the date on which they were created. But I am unable to get the information for the individual dates once all the excel sheets have been loaded in the script.
I even tried creating the Date field for each row in the excel sheet before I loaded them like you suggested (did I assume correctly?), but once the data is loaded, the association seems have got lost.
Regards,
Kanchana
- Mark as New
- Bookmark
- Subscribe
- Mute
- Subscribe to RSS Feed
- Permalink
- Report Inappropriate Content
Hi Kanchana,
Is your file(s) name contains date? If yes, we can extract date straight away.
ex: I have a file with name "MAC_R2_CR_PBTV_ACCOUNTS_08-June-2017.xlsx " and which is having 2 columns ID and Name.
Below is my script to get data from the file along with the date.
LOAD ID,
Name,
Date(Date#(SubField(FileBaseName(),'_',-1),'DD-MMM-YYYY')) as DateExtracted
FROM
(ooxml, embedded labels, table is Sheet1);
Output:

If possible, share your sample app with couple of files data.
- Mark as New
- Bookmark
- Subscribe
- Mute
- Subscribe to RSS Feed
- Permalink
- Report Inappropriate Content
Hi Prashanth,
Yes, I have the dates in my file names and I have extracted them just as you have shown here. But when there is more than one file, this is how my pivot chart looks when I try to display values only from one particular date.
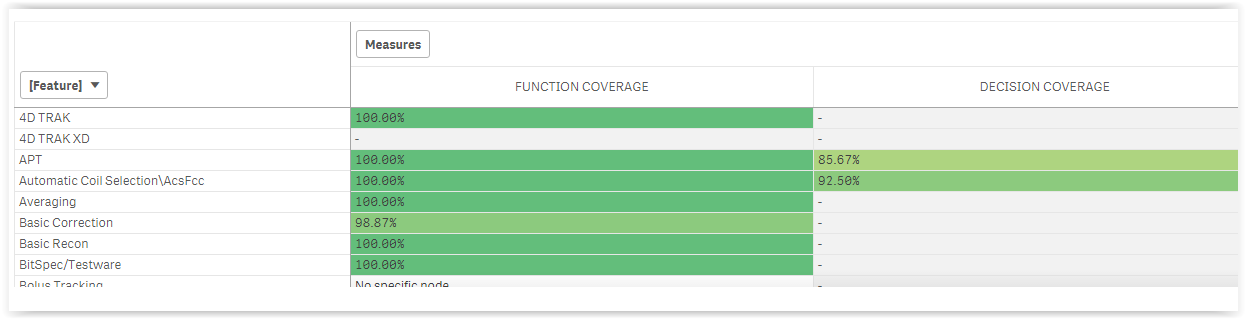
The values are displayed only if they are the same in all the files. Otherwise, it shows a blank. I am not sure what expression I need to use to display only those values that are from the MaxDate.
Regards,
Kanchana
- Mark as New
- Bookmark
- Subscribe
- Mute
- Subscribe to RSS Feed
- Permalink
- Report Inappropriate Content
I would start with checking if the table chart shows what you want when you select the file date in a filter pane (maybe remove the set expression from your Only() function to avoid a conflict between the selection and the set expression).
If it does work, then your set expression is not correct.
{<[File Date] = MaxDate >}
is basically copying the selection in field MaxDate to [File Date]. I assume that you don't have an active selection in this field?
And from what I've learned above, your MaxDate field shows two dates, but you want to show the data for the min date of the two?
Check if
=Only( If( [File Date] = Minstring(MaxDate), [Value_1]))
returns what you want (without any selection in the date fields).
If yes, you can create also a set expression with this filter, but you need to take care of some Qlik specifics (basically value formatting in the set modifier):
Maybe something like
=Only({<[File Date] = {'$(=Date(Max({1} [File Date],2)))'} >} [Value_1])
edit: and again, all help would be much easier if you could provide a small sample application
- Mark as New
- Bookmark
- Subscribe
- Mute
- Subscribe to RSS Feed
- Permalink
- Report Inappropriate Content
Hi Kanchana,
in the excel file in wich format are the numers? Are they numbers or text?
Why your percentage are alligned on the left?
Perhaps You need to convert them in numbers.
- Mark as New
- Bookmark
- Subscribe
- Mute
- Subscribe to RSS Feed
- Permalink
- Report Inappropriate Content
So, you are talking about '4D TRAK' and '4D TRAK XD'... Ryt?
Upon particular date (or any other filter selection), it will display the values (Feature) which are related to the date.
I believe 4D TRAK XD is in ur data set for that period and may be the values for the fields which you used in expression may be blank.
Easy way to get rid of blank rows is by unchecking "Include Null Values".
- Mark as New
- Bookmark
- Subscribe
- Mute
- Subscribe to RSS Feed
- Permalink
- Report Inappropriate Content
Hi Stefan,
Sorry for the delay in reponding to your mail - I was trying all the suggested options and found that filtering the date in the way you have suggested works in my case. Thank you so much for your kind help, my problem is solved now!
Regards,
Kanchana
- Mark as New
- Bookmark
- Subscribe
- Mute
- Subscribe to RSS Feed
- Permalink
- Report Inappropriate Content
Thanks Camillo. Yes, I have purposely converted them to text for display purposes to have left alignment. But that doesn't interfere with my calculations as the text format is only for display.
Regards,
Kanchana
- Mark as New
- Bookmark
- Subscribe
- Mute
- Subscribe to RSS Feed
- Permalink
- Report Inappropriate Content
Hi Prashanth,
No, this blank display was a problem across all data when the values were different across the files. But I have solved it by using Stefan's suggestion for filtering the date using Set analysis.
Thanks so much for all your help!
Regards,
Kanchana
- « Previous Replies
-
- 1
- 2
- Next Replies »