Unlock a world of possibilities! Login now and discover the exclusive benefits awaiting you.
- Qlik Community
- :
- Forums
- :
- Analytics
- :
- App Development
- :
- Set Analysis for a semi-additive metric
- Subscribe to RSS Feed
- Mark Topic as New
- Mark Topic as Read
- Float this Topic for Current User
- Bookmark
- Subscribe
- Mute
- Printer Friendly Page
- Mark as New
- Bookmark
- Subscribe
- Mute
- Subscribe to RSS Feed
- Permalink
- Report Inappropriate Content
Set Analysis for a semi-additive metric
I am currently attempting to replace an old Essbase cube with a Qlik Sense app. The cube pulls it's data from a semi-additive daily snapshot table in our data warehouse. The metric fields in that table are semi-additive in the sense that they can be summed across all dimensions except time.
To match the functionality of the cube, I have created several drill down dimensions, including one called Period (Year>Quarter>Month>Date). I would like to create a set analysis that sums the metrics by all dimensions, except the Period dimension. In the case of the Period dimension, I would like to app to display the last value (most recent) in the selected period.
For example:
When I am on the year level of the Period dimension, the app should show the metric value for the date of:
2014: 12/31/2014
2015: 12/22/2015 (that is the most recent snapshot as of today)
When I am on the quarter level of the Period dimension, the app should show the metric value for the date of
Q3-15: 9/30/2015
Q4-15: 12/22/2015 (that is the most recent snapshot as of today)
When I am on the month level of the Period dimension, the app should show the metric value for the date of:
Sep-15: 9/30/2015
Oct-15: 10/31/2015
Nov-15: 11/30/2015
Dec-15: 12/22/2015 (that is the most recent snapshot as of today)
I have been able to connect the app directly to the cube, but I would like to eventually get rid of the cube. So, if anyone has any suggestions on how to accomplish using set analysis, I would greatly appreciate it.
Thanks,
Ben
- Mark as New
- Bookmark
- Subscribe
- Mute
- Subscribe to RSS Feed
- Permalink
- Report Inappropriate Content
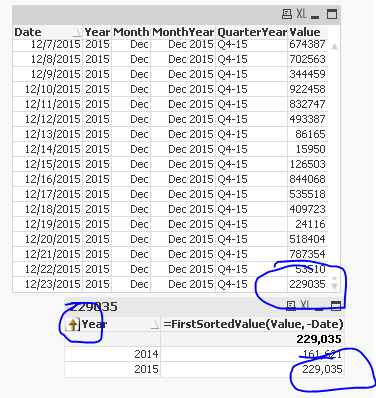
Try the FirstSortedValue() function:
Sample Script:
Table:
LOAD Date,
Year(Date) as Year,
Month(Date) as Month,
MonthName(Date) as MonthYear,
'Q' & Ceil(Month(Date)/3) & '-' & Right(Year(Date), 2) as QuarterYear,
Ceil(Rand() * 1000000) as Value;
LOAD Date(MakeDate(2013, 12, 31) + RecNo()) as Date
AutoGenerate (Today() - MakeDate(2013, 12, 31));
Drill Down Group: Year -> QuarterYear -> MonthYear
Expression: =FirstSortedValue(Value, -Date)
- Mark as New
- Bookmark
- Subscribe
- Mute
- Subscribe to RSS Feed
- Permalink
- Report Inappropriate Content
Try sum(aggr(FirstSortedValue(Amount, -Date), Dim1, Dim2,..., DimN). Replace Amount and Date with the appropriate field names and replace Dim1, Dim2,..., DimN with the field names of the chart dimensions.
talk is cheap, supply exceeds demand
- Mark as New
- Bookmark
- Subscribe
- Mute
- Subscribe to RSS Feed
- Permalink
- Report Inappropriate Content
Thanks for you quick responses. Both helped me get to a solution. I forgot to mention in my first post that I have more than one type of measure in my fact table, so I need to use Set Analysis in addition to the functions. Here are two of the expressions that I am using in my app:
FirstSortedValue({$<[METRIC_TYPE] = {'ACCOUNT COUNT'}>} Aggr(Sum({$<[METRIC_TYPE] = {'ACCOUNT COUNT'}>} METRIC), PERIOD), -PERIOD)
;
FirstSortedValue({$<[METRIC_TYPE] = {'EVENT COUNT'}>} Aggr(Sum({$<[METRIC_TYPE] = {'EVENT COUNT'}>} METRIC), PERIOD), -PERIOD)