Unlock a world of possibilities! Login now and discover the exclusive benefits awaiting you.
- Qlik Community
- :
- Forums
- :
- Analytics
- :
- App Development
- :
- Set Modifer not working as I thought it would when...
- Subscribe to RSS Feed
- Mark Topic as New
- Mark Topic as Read
- Float this Topic for Current User
- Bookmark
- Subscribe
- Mute
- Printer Friendly Page
- Mark as New
- Bookmark
- Subscribe
- Mute
- Subscribe to RSS Feed
- Permalink
- Report Inappropriate Content
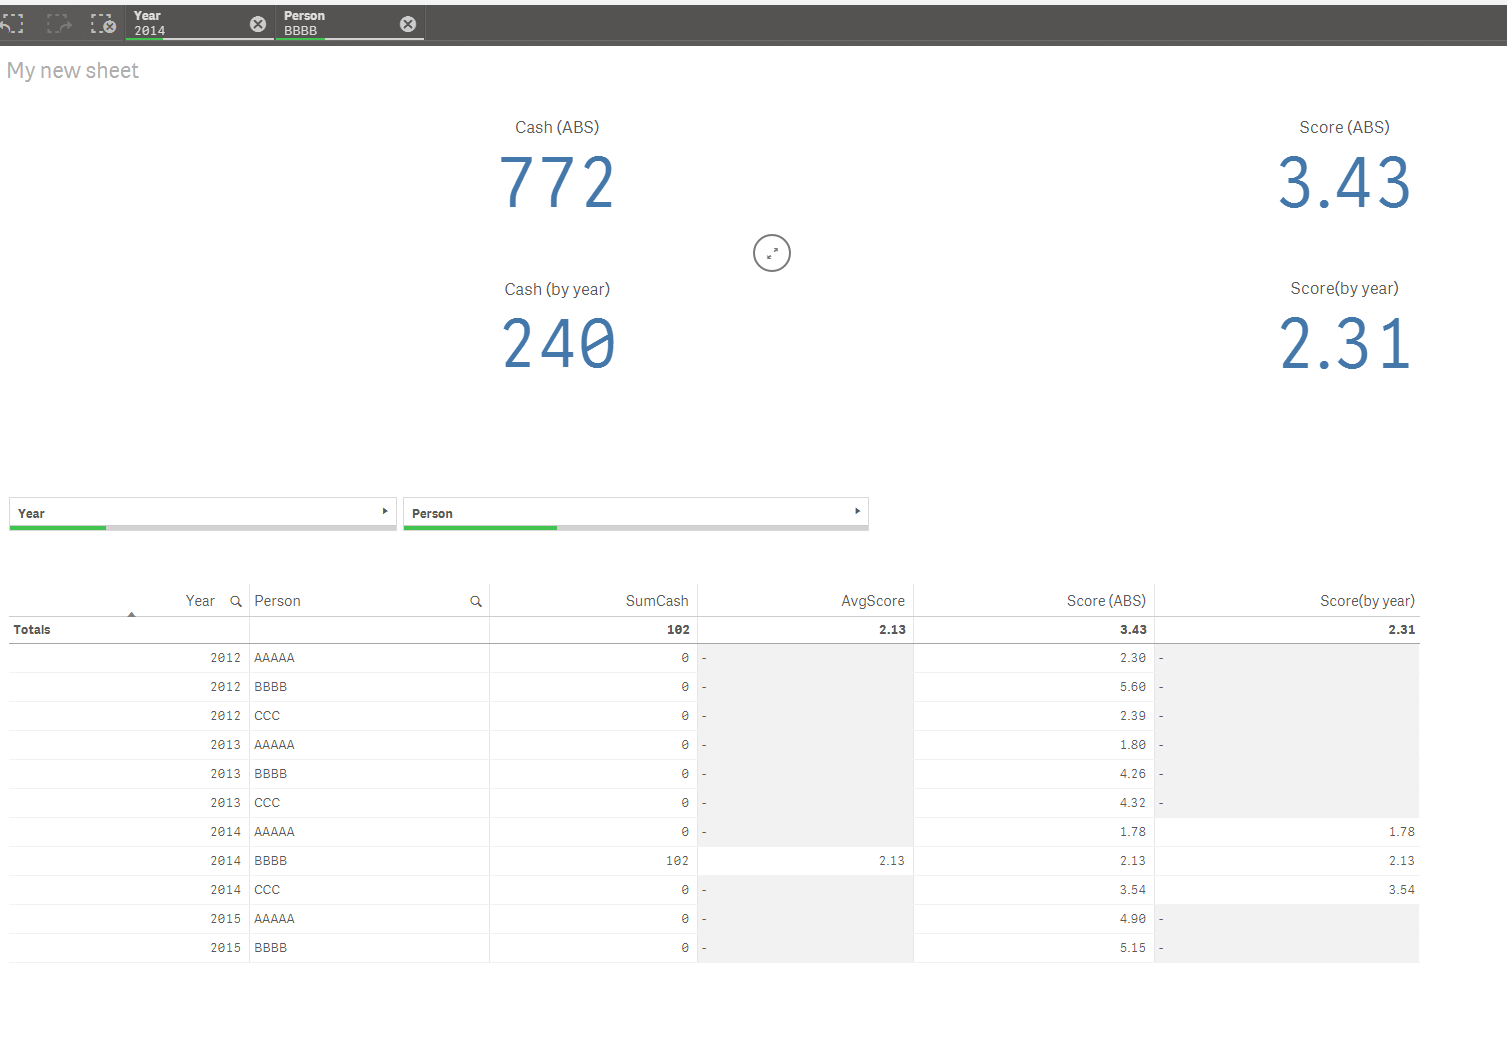
Set Modifer not working as I thought it would when placed in a table
(See the attached sample)
I've created a Measure using the {1} set modifer that is the average score of the entire data set (i.e. doesn't vary with selections.) If I display that measure in a KPI, it works as I expected - it always shows the same value regardless of the selections. However, if I put that measure in a table with the data, it ignores the set modifier. Is there a way to put it in a table so it keeps the same value it shows outside of the table?
A more complicated case is using a set modifier to get an average score that is sensitive to the year {$<Person = >}, but not the person. i.e. it is the average score for the year or years selected. Again in a KPI it does what I want, but in a table it gets ignored.
The attached is a simplified version of the data.
Accepted Solutions
- Mark as New
- Bookmark
- Subscribe
- Mute
- Subscribe to RSS Feed
- Permalink
- Report Inappropriate Content
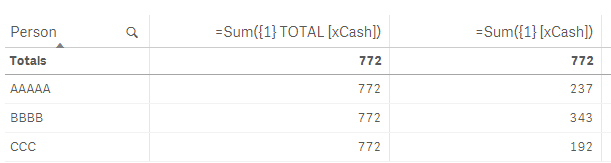
This should work (take care to use a separator /space between TOTAL and field name)
Sum({1} TOTAL [xCash])
Read also
- Mark as New
- Bookmark
- Subscribe
- Mute
- Subscribe to RSS Feed
- Permalink
- Report Inappropriate Content
It seems to work for me, or maybe I don't understand your request.
- Mark as New
- Bookmark
- Subscribe
- Mute
- Subscribe to RSS Feed
- Permalink
- Report Inappropriate Content
Hi,
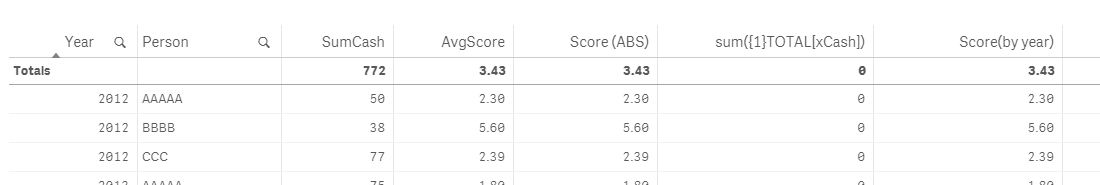
If you use sum({1} xCash) and you want to use is in table with dimension f.e. Person you need to remember that the value will be splitted by dimension regardless set modifier.
If you want to see aggregated value despite dimension you need to use TOTAL (or more compicated aggregation function) for that measure as shown below. Please also read about expressions in reference manual or Qlik Sense help.
BR,
Milosz
- Mark as New
- Bookmark
- Subscribe
- Mute
- Subscribe to RSS Feed
- Permalink
- Report Inappropriate Content
i think you need to write like this
=sum({1<........>}..................)
- Mark as New
- Bookmark
- Subscribe
- Mute
- Subscribe to RSS Feed
- Permalink
- Report Inappropriate Content
Milosz,
Thanks for the response. If I'm reading your first sentence correctly, you are saying that syntax {$<Person = >} doesn't mean anything when the measure is in a data grid. Is that correct?
I tried your Sum({1}TOTAL[xCash]) syntax, but get zero's for results. I'll check the doc to see what I did wrong, but if you could post your app file, that would be great.
Thanks,
Randy
- Mark as New
- Bookmark
- Subscribe
- Mute
- Subscribe to RSS Feed
- Permalink
- Report Inappropriate Content
The value in the Score(ABS) column should always equal the value shown in the KPI. Same with the value in the Score(by year) column. So in your screenshot, I want all the values in Score(ABS) to equal 3.43 and all the values in the Score(by year) column to equal 2.31.
FYI, what I really want to do is show a ratio of the AvgScore column to the Score(ABS) and Score(by year) columns, but my problem is easier to see if I show these values instead.
- Mark as New
- Bookmark
- Subscribe
- Mute
- Subscribe to RSS Feed
- Permalink
- Report Inappropriate Content
This should work (take care to use a separator /space between TOTAL and field name)
Sum({1} TOTAL [xCash])
Read also
- Mark as New
- Bookmark
- Subscribe
- Mute
- Subscribe to RSS Feed
- Permalink
- Report Inappropriate Content
That was it. Thanks!
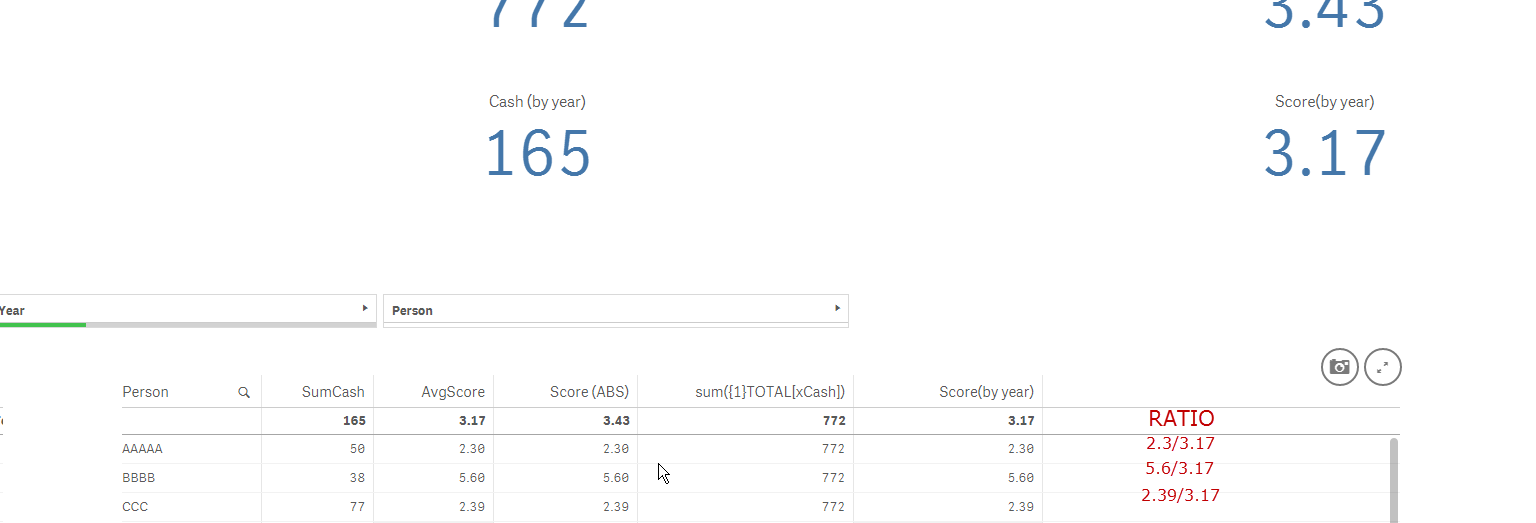
Now I know how to handle the Score(ABS) case, but I'm still struggling with the Score(by year) case. The case makes a little more sense if I remove the 'Year' column from the datagrid (see attached .qvf and image below.) What I'm trying to show in the data grid is the ration of the person's score with the average score for the selected time frame (e.g. 2012, 2012+2013, etc.). I'll read to aggregation link you provided to see if that helps.
- Mark as New
- Bookmark
- Subscribe
- Mute
- Subscribe to RSS Feed
- Permalink
- Report Inappropriate Content
That aggregation link explained it for me. Avg({$<Person = >} TOTAL yScore) gives me what I was looking for. Thanks!