Unlock a world of possibilities! Login now and discover the exclusive benefits awaiting you.
- Qlik Community
- :
- Forums
- :
- Analytics
- :
- App Development
- :
- Set X-axis range in combo chart
- Subscribe to RSS Feed
- Mark Topic as New
- Mark Topic as Read
- Float this Topic for Current User
- Bookmark
- Subscribe
- Mute
- Printer Friendly Page
- Mark as New
- Bookmark
- Subscribe
- Mute
- Subscribe to RSS Feed
- Permalink
- Report Inappropriate Content
Set X-axis range in combo chart
Hi everyone,
the question is quite simple: in a combo chart (1 dimension and 2 measures, even though this is not important) I would like to fix the range of values on the X-axis. Generally, this is quite simple: in chart properties >> Appearance >> X-axis >> Range it is possible to set a minimum and maximum value for the axis.
The problem is there isn't such property for X-axis of combo chart, and the range of it is automatically selected.
Any idea to assign minimum and maximum values of X-axis in combo chart?
- Tags:
- combo chart
Accepted Solutions
- Mark as New
- Bookmark
- Subscribe
- Mute
- Subscribe to RSS Feed
- Permalink
- Report Inappropriate Content
Now I get your point. Unfortunately it is not possible to set the ranges in X axis for combo chart...
But the X axis's range is created automatically according to the available values. Does your reference line data has values for the desired min and max? Maybe this should fix the chart.
- Mark as New
- Bookmark
- Subscribe
- Mute
- Subscribe to RSS Feed
- Permalink
- Report Inappropriate Content
I understood what you asked, but honestly I don't understand why you need it like this.
The X axis is related to a dimension field with discrete values. Most of times, we have textual values. For example if the dimension is Product, which values would you put for min and max ranges?
- Mark as New
- Bookmark
- Subscribe
- Mute
- Subscribe to RSS Feed
- Permalink
- Report Inappropriate Content
Hi Fosuzuki,
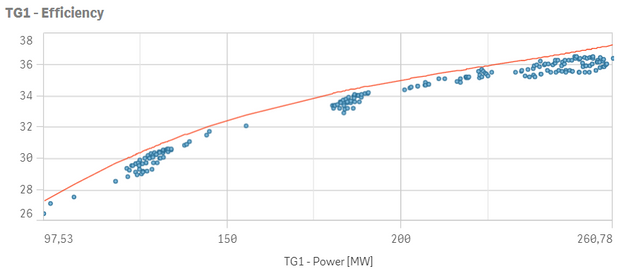
I got your point. I show you a typical example of a combo chart of my app:
The aim of this is to compare the actual performance of a piece of equipment (blue dots) with its expected one (red line). Since the value of the red line are time-bounded and are re-calculated monthly with a complex formula, I cannot substitute them defining a reference line in Qlik and I need to calculate those values using a Phyton script and then I load them in Qlik. This is why I'm using a combo chart.
At the same time, I'd like to fix the X range between 80 and 280 MW, since this is the full operational power range of the piece of equipment.
- Mark as New
- Bookmark
- Subscribe
- Mute
- Subscribe to RSS Feed
- Permalink
- Report Inappropriate Content
Now I get your point. Unfortunately it is not possible to set the ranges in X axis for combo chart...
But the X axis's range is created automatically according to the available values. Does your reference line data has values for the desired min and max? Maybe this should fix the chart.
