Unlock a world of possibilities! Login now and discover the exclusive benefits awaiting you.
- Qlik Community
- :
- Forums
- :
- Analytics
- :
- App Development
- :
- Show Total next to a bar in barchart
- Subscribe to RSS Feed
- Mark Topic as New
- Mark Topic as Read
- Float this Topic for Current User
- Bookmark
- Subscribe
- Mute
- Printer Friendly Page
- Mark as New
- Bookmark
- Subscribe
- Mute
- Subscribe to RSS Feed
- Permalink
- Report Inappropriate Content
Show Total next to a bar in barchart
Hi All,
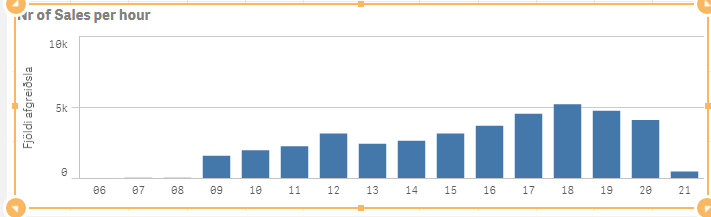
I have a barchart and I would like to show on the barchart the total no. of sales ie. not broken down by hour. So the idea would be to give the user an sense of how the load is per hour compared to the total. So for example at 12 we have 3k sales and the total is 39k so it around 7,6 % of the total no of sales.
Count(distinct [TransactionNo])
Hopefully this makes sense. Any hints are appreciated and Ideas of presentation.
regards
Birkir
- Mark as New
- Bookmark
- Subscribe
- Mute
- Subscribe to RSS Feed
- Permalink
- Report Inappropriate Content
May be this
Count(DISTINCT [TransactionNo])/Count(TOTAL DISTINCT [TransactionNo])
or
Count(DISTINCT [TransactionNo])/Aggr(NODISTINCT Count(DISTINCT [TransactionNo]), Hour)
- Mark as New
- Bookmark
- Subscribe
- Mute
- Subscribe to RSS Feed
- Permalink
- Report Inappropriate Content
Hi Sunny,
This worked, thank you for your help.
- Mark as New
- Bookmark
- Subscribe
- Mute
- Subscribe to RSS Feed
- Permalink
- Report Inappropriate Content
Awesome 
Please close the thread in that case by marking correct response.
Qlik Community Tip: Marking Replies as Correct or Helpful
Best,
Sunny