Unlock a world of possibilities! Login now and discover the exclusive benefits awaiting you.
- Qlik Community
- :
- Forums
- :
- Analytics
- :
- App Development
- :
- Showing trended metrics based on different date fi...
- Subscribe to RSS Feed
- Mark Topic as New
- Mark Topic as Read
- Float this Topic for Current User
- Bookmark
- Subscribe
- Mute
- Printer Friendly Page
- Mark as New
- Bookmark
- Subscribe
- Mute
- Subscribe to RSS Feed
- Permalink
- Report Inappropriate Content
Showing trended metrics based on different date fields
Hi,
I have a table “Trended Data” that contains monthly data and is unique on Parts ID & Data As Of Date where Data As Of Date is my month end dates. I have another table “Completed Dates” that contains three columns Part ID, Completed Date, Cost. Completed Date does not have to be a month end date. I would like to have the ability to show two different things on a sheet using these two tables.
- Show a trended bar chart with “Data As Of Date” as my dimension with various metrics from the “Trended Data” table. Along with those metrics I would like to show a measure for the field “Cost” from the “Completed Dates”. If I create a measure “SUM(Cost)”, then I would receive a constant value of total Cost for all parts across each Data As Of Dates. I only want to sum up the Cost of all parts when the month end date of Completed Date is equal to Data As Of Date. (Remember Completed Date can be a mid-month date.) The equation listed below only works if I looked at parts with the same Completed Date.
Sum(if([Data As Of Date]='$(=Date(MonthEnd(floor([Completed Date])),'MM/DD/YYYY'))', ([Cost]),null()))
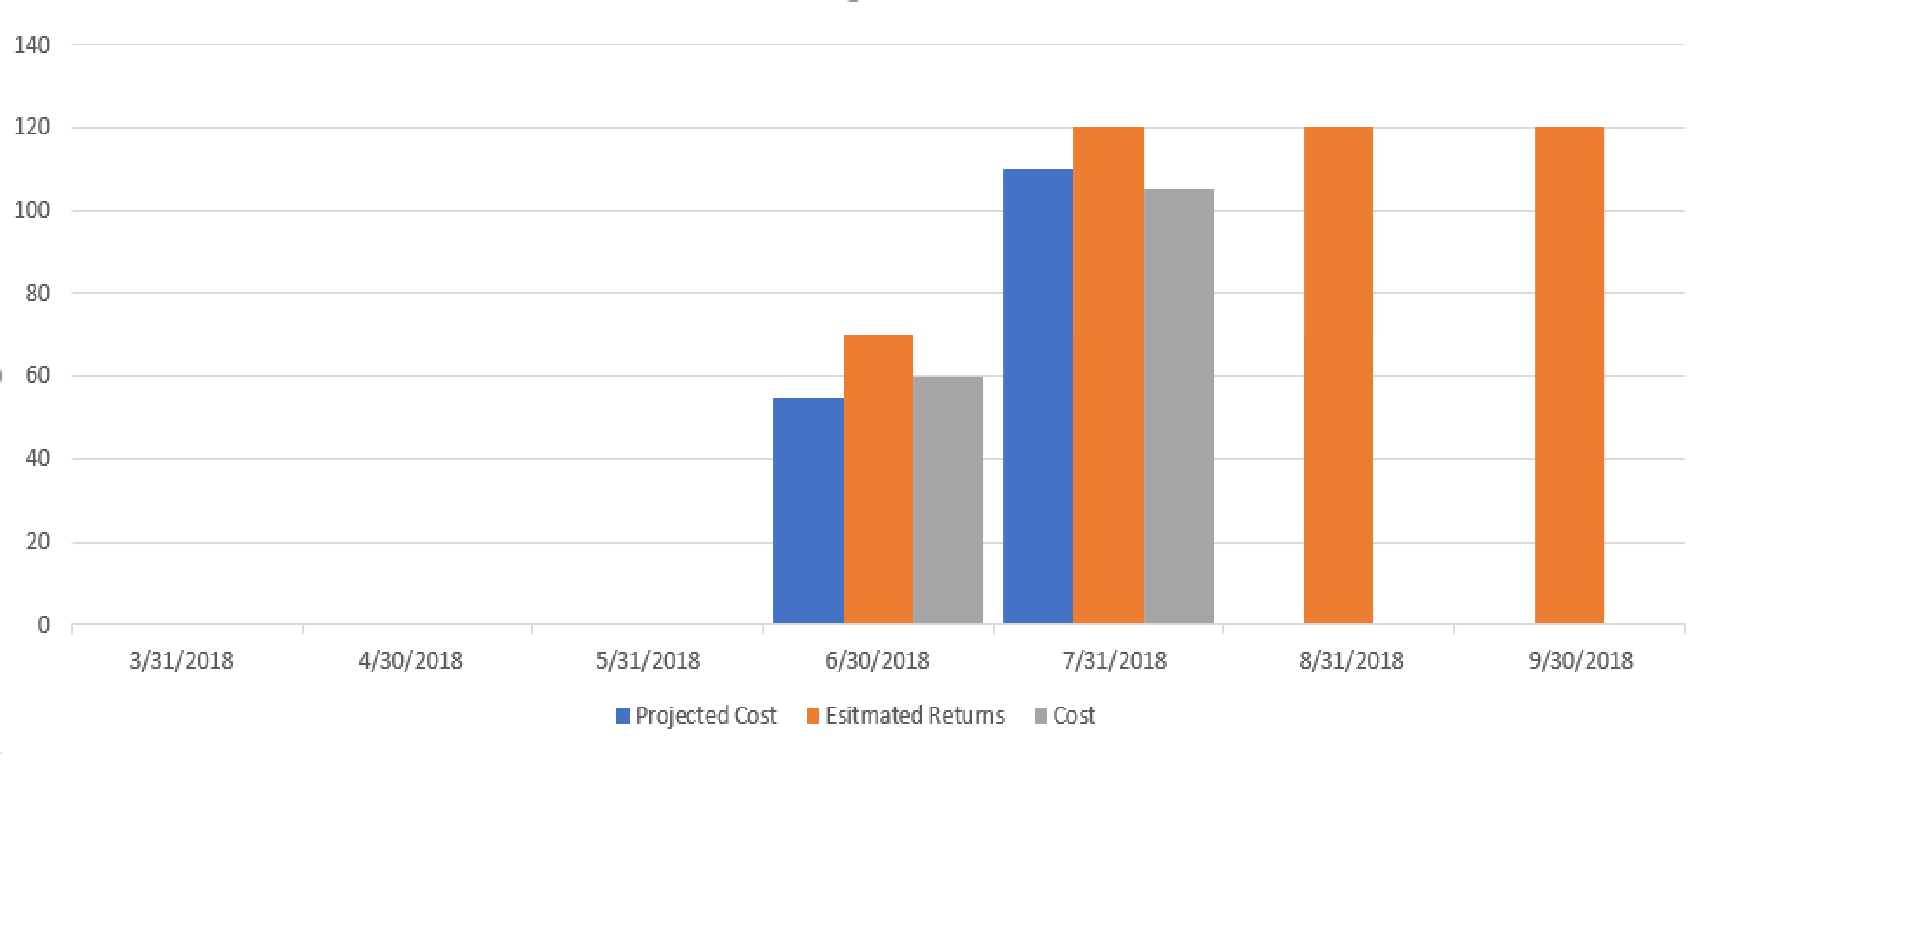
- On the same trended bar chart, I I would also like to see metrics from the “Trended Data” table for the month-end prior to the “Completed Date” for a Part ID in a bar chart with “Data As Of Date” as the dimension. For some metrics, I will only want to see this value in the month of completion while other metrics I will want to see it in the month of completion and forward. For example, from the Trended Data table I have fields “Estimated Return” and “Projected Cost”. I would like to see the “Estimated Return” value from the month before completion for all Data As Of Dates during and after the Completion Date. For “Projected Cost”, I would only like to see the value from the month before completion for just the Data As Of Date equal to the month end of Completion Date. I have shown an example below for some sample data.
I have listed an example of data for just two Part IDs (imagine I have a lot more than just 2).
Trended Data Table
| Part ID | Data As Of Date | Projected Cost | Estimated Returns |
| AAA | 3/31/2018 | 45 | 65 |
| AAA | 4/30/2018 | 50 | 70 |
| AAA | 5/31/2018 | 55 | 70 |
| AAA | 6/30/2018 | 0 | 0 |
| AAA | 7/31/2018 | 0 | 0 |
| AAA | 8/31/2018 | 0 | 0 |
| AAA | 9/30/2018 | 0 | 0 |
| BBB | 3/31/2018 | 80 | 97 |
| BBB | 4/30/2018 | 90 | 120 |
| BBB | 5/31/2018 | 100 | 120 |
| BBB | 6/30/2018 | 110 | 120 |
| BBB | 7/31/2018 | 0 | 0 |
| BBB | 8/31/2018 | 0 | 0 |
| BBB | 9/30/2018 | 0 | 0 |
Completed Dates Table
| Part ID | Completed Date | Cost |
| AAA | 6/28/2018 | 60 |
| BBB | 7/10/2018 | 105 |
I’m open to updating the loading script but I’d like to be able to develop some logic with a formula on a sheet because it would allow all users to be able to add more metrics on their own.
Thank you,
Brian