Unlock a world of possibilities! Login now and discover the exclusive benefits awaiting you.
- Qlik Community
- :
- Forums
- :
- Analytics
- :
- App Development
- :
- Re: Stacked charts
- Subscribe to RSS Feed
- Mark Topic as New
- Mark Topic as Read
- Float this Topic for Current User
- Bookmark
- Subscribe
- Mute
- Printer Friendly Page
- Mark as New
- Bookmark
- Subscribe
- Mute
- Subscribe to RSS Feed
- Permalink
- Report Inappropriate Content
Stacked charts
Hello.
I am looking for information here, as in the QlikSense create a stacked chart. The options are many. And someone knows why the developers did not include such a possibility? And whether it will be included in the future?
Accepted Solutions
- Mark as New
- Bookmark
- Subscribe
- Mute
- Subscribe to RSS Feed
- Permalink
- Report Inappropriate Content
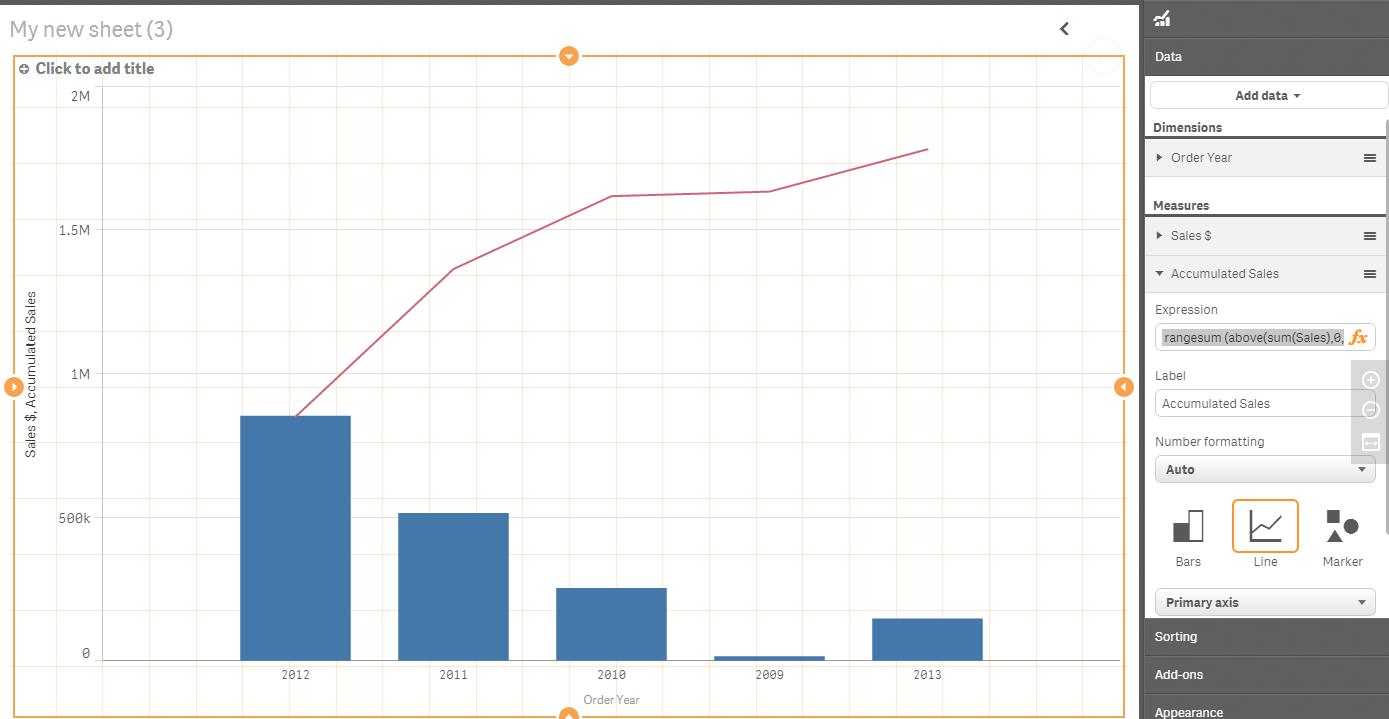
Thanks for the description.
If the bar had an expression of: sum(Qty)
Try make the line have an expression of
rangesum (above(sum(Qty),0,rowno()))
- Mark as New
- Bookmark
- Subscribe
- Mute
- Subscribe to RSS Feed
- Permalink
- Report Inappropriate Content
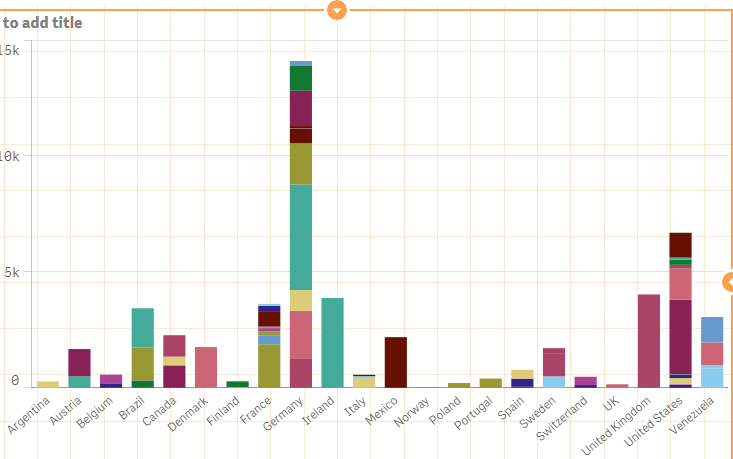
Can you be more specific ?
There are stacked bar charts in Qlik Sense (see below)
- Mark as New
- Bookmark
- Subscribe
- Mute
- Subscribe to RSS Feed
- Permalink
- Report Inappropriate Content
Hi. it's not that. I need to visualize the dynamics of the receipt of revenue days in the graph with accumulation. Apparently, I misspoke, in the Russian language the notions of graph and chart very near
- Mark as New
- Bookmark
- Subscribe
- Mute
- Subscribe to RSS Feed
- Permalink
- Report Inappropriate Content
No problem ! Can you post a picture of what you are trying to do ?
- Mark as New
- Bookmark
- Subscribe
- Mute
- Subscribe to RSS Feed
- Permalink
- Report Inappropriate Content
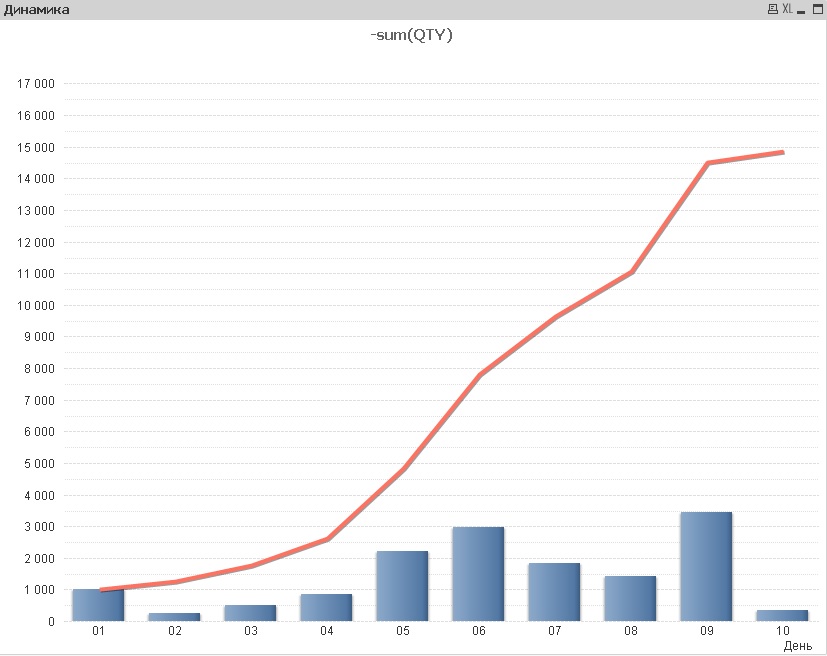
Hi. In QlikView it looks like this
- Mark as New
- Bookmark
- Subscribe
- Mute
- Subscribe to RSS Feed
- Permalink
- Report Inappropriate Content
Chart - daily movement, red graph is accumulation of all past values in the range
- Mark as New
- Bookmark
- Subscribe
- Mute
- Subscribe to RSS Feed
- Permalink
- Report Inappropriate Content
Hi Alexey,
I think there is no accumulation in Combo yet.
BR
Serhan
- Mark as New
- Bookmark
- Subscribe
- Mute
- Subscribe to RSS Feed
- Permalink
- Report Inappropriate Content
Thanks for the description.
If the bar had an expression of: sum(Qty)
Try make the line have an expression of
rangesum (above(sum(Qty),0,rowno()))
- Mark as New
- Bookmark
- Subscribe
- Mute
- Subscribe to RSS Feed
- Permalink
- Report Inappropriate Content
Yes, it worked. And you can read more in the official course there is nothing about rangesum =( (or I do not watch it)
Thank you.