Unlock a world of possibilities! Login now and discover the exclusive benefits awaiting you.
- Qlik Community
- :
- Forums
- :
- Analytics
- :
- App Development
- :
- Re: Sum with dimensions and sub dimensions
- Subscribe to RSS Feed
- Mark Topic as New
- Mark Topic as Read
- Float this Topic for Current User
- Bookmark
- Subscribe
- Mute
- Printer Friendly Page
- Mark as New
- Bookmark
- Subscribe
- Mute
- Subscribe to RSS Feed
- Permalink
- Report Inappropriate Content
Sum with dimensions and sub dimensions
Hi,
I have the following sample of data:
| code | Q1 | Q1 OP | Q1 VALUE | F |
| 46401606 | Q106_7 | Q106_7_1 | 0 | 55.55556 |
| 46401606 | Q106_7 | Q106_7_2 | 0 | 55.55556 |
| 46401606 | Q106_7 | Q106_7_3 | 1 | 55.55556 |
| 46401606 | Q106_7 | Q106_7_4 | 0 | 55.55556 |
| 46401606 | Q106_7 | Q106_7_5 | 0 | 55.55556 |
| 46401606 | Q106_7 | Q106_7_6 | 0 | 55.55556 |
| 46401615 | Q106_7 | Q106_7_1 | 1 | 47 |
| 46401615 | Q106_7 | Q106_7_2 | 0 | 47 |
| 46401615 | Q106_7 | Q106_7_3 | 0 | 47 |
| 46401615 | Q106_7 | Q106_7_4 | 0 | 47 |
| 46401615 | Q106_7 | Q106_7_5 | 1 | 47 |
| 46401615 | Q106_7 | Q106_7_6 | 0 | 47 |
| 46401628 | Q106_7 | Q106_7_1 | 0 | 41.46154 |
| 46401628 | Q106_7 | Q106_7_2 | 0 | 41.46154 |
| 46401628 | Q106_7 | Q106_7_3 | 1 | 41.46154 |
| 46401628 | Q106_7 | Q106_7_4 | 0 | 41.46154 |
| 46401628 | Q106_7 | Q106_7_5 | 0 | 41.46154 |
| 46401628 | Q106_7 | Q106_7_6 | 0 | 41.46154 |
| 46401632 | Q106_7 | Q106_7_1 | 1 | 191 |
| 46401632 | Q106_7 | Q106_7_2 | 0 | 191 |
| 46401632 | Q106_7 | Q106_7_3 | 0 | 191 |
| 46401632 | Q106_7 | Q106_7_4 | 0 | 191 |
| 46401632 | Q106_7 | Q106_7_5 | 0 | 191 |
| 46401632 | Q106_7 | Q106_7_6 | 0 | 191 |
If i set a bar chart with the dimension Q1 OP and the following metric:
sum({$<Q1_VALUE={1}>} F) / sum(total {$<Q1_VALUE={1,0}>} F)
The values that are displayed are correct, split by Q1 OP. But the same chart with the dimension Q1 shows incorrect values. Shouldn't the chart with dimension Q1 display the same values as Q1 OP but added up?
Thanks.
- Tags:
- sum not working
Accepted Solutions
- Mark as New
- Bookmark
- Subscribe
- Mute
- Subscribe to RSS Feed
- Permalink
- Report Inappropriate Content
Question, you have changed the dimension from Q1 OP to Q1 or are you just adding Q1 to Q1 OP? If you replaced, then may be try this
Sum(Aggr(Sum({$<Q1_VALUE={1}>} F) / Sum(TOTAL <Q1> {$<Q1_VALUE={1,0}>} F), Q1, [Q1 OP]))
- Mark as New
- Bookmark
- Subscribe
- Mute
- Subscribe to RSS Feed
- Permalink
- Report Inappropriate Content
Not entirely sure I understand... but may be you need this
Sum({$<Q1_VALUE={1}>} F) / Sum(TOTAL <Q1> {$<Q1_VALUE={1,0}>} F)
- Mark as New
- Bookmark
- Subscribe
- Mute
- Subscribe to RSS Feed
- Permalink
- Report Inappropriate Content
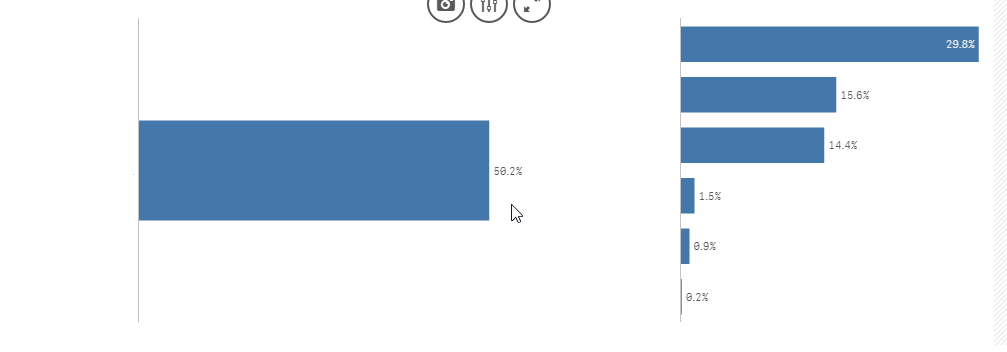
Hi, i've tried that and it makes no difference to the values presented. I've blanked out the names of the categories, but the chart on the left should add the values of the chart on the right.
- Mark as New
- Bookmark
- Subscribe
- Mute
- Subscribe to RSS Feed
- Permalink
- Report Inappropriate Content
Question, you have changed the dimension from Q1 OP to Q1 or are you just adding Q1 to Q1 OP? If you replaced, then may be try this
Sum(Aggr(Sum({$<Q1_VALUE={1}>} F) / Sum(TOTAL <Q1> {$<Q1_VALUE={1,0}>} F), Q1, [Q1 OP]))
- Mark as New
- Bookmark
- Subscribe
- Mute
- Subscribe to RSS Feed
- Permalink
- Report Inappropriate Content
Hi,
That's it, thanks for your help. If it's not much to ask, can you explain the logic behind your thinking ?
- Mark as New
- Bookmark
- Subscribe
- Mute
- Subscribe to RSS Feed
- Permalink
- Report Inappropriate Content
Basically, you were only showing Q1, but you really wanted to perform the calculation at the Q1 OP level and then add it up... So, in order to do that you can use Aggr() function... which create a virtual table where there are two dimensions Q1 and Q1 OP and perform the calculation with both dimensions. And later Sum() function just sums up all the values of all Q1 OP within the Q1.
Second part, was the TOTAL qualifier. Here we needed to add <Q1> because when you performed the calculation... it seems that you only had selected a single Q1.... which is why you saw the total for Q106_7. But if nothing was selected... it would have showed overall total... in order to make the total for each Q1, I added TOTAL <Q1>.
- Mark as New
- Bookmark
- Subscribe
- Mute
- Subscribe to RSS Feed
- Permalink
- Report Inappropriate Content
Perfect. Thank you again.