Unlock a world of possibilities! Login now and discover the exclusive benefits awaiting you.
- Qlik Community
- :
- Forums
- :
- Analytics
- :
- App Development
- :
- Re: Table should show rows with several contract t...
- Subscribe to RSS Feed
- Mark Topic as New
- Mark Topic as Read
- Float this Topic for Current User
- Bookmark
- Subscribe
- Mute
- Printer Friendly Page
- Mark as New
- Bookmark
- Subscribe
- Mute
- Subscribe to RSS Feed
- Permalink
- Report Inappropriate Content
Table should show rows with several contract types, but does not for calculated measure
Hello,
I've been trying to solve the Problem below for quite some time now. Can anyone please help me with this issue:
In my Qlik Sense app I have the following 3 measures:
1. New Contracts: Sum (Contract_Counter)
2. Vehicle_Sales: Sum({< Contract_Type = >} Vehicle_Sales)
3. Penetration_Rate: Sum (Contract_Counter) / Sum({< Contract_Type = >} Vehicle_Sales)
Now we have 3 dimensions:
1. Date
2. Vehicle_Type
3. Contract_Type
CONTRACT details cover all 3 dimensions, while VEHICLE details only cover Date and Vehicle_Type.
Therefore I have to use set analysis for the Vehicle_Sales formula to ignore any selection made on Contract Type:
Sum({< Contract_Type = >} Vehicle_Sales)
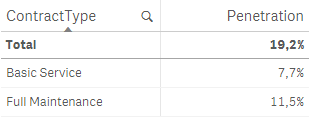
The Penetration_Rate formula works fine as long as we are on top Level, i.e. we do not show any contract types:

Also, if I select a specific contract type (e.g. "Full Maintenance"), the result is correct:

BUT, if I want to show the Penetration per contract type in a table or pivot table, the result looks as follows:

If I select "Full Maintenance" the table looks like:

In both cases the total figures 23.1% and 5.9% are correct, but the rows in the table are not filled out.
As far as I understand Qlik Sense, all rows are correct:
Full Maintenance is "-" because we have e.g. 59 contracts, but no vehicle sales on that contract type. Also the "-" row is correct, because we have 0 contracts without contract type, but 1000 vehicle sales.
In total the 5.9% Penetration is calculated, because across all contract types we have 59 contracts and 1000 vehicle sales = 5.9%.
What can I do to get a table like this?

Thanks a lot in advance for your support.
Kind regards
Michael
- Mark as New
- Bookmark
- Subscribe
- Mute
- Subscribe to RSS Feed
- Permalink
- Report Inappropriate Content
I'd like you to put both the numerator and the denominator for this expression as 2 new measures in your table broken out by contract.
Sum (Contract_Counter) / Sum({< Contract_Type = >} Vehicle_Sales)
My sense is that the denominator is evaluating to null and causing the issue.
It may depend on your data model (so i'm not 100% sure) but you could also try:
Sum (Contract_Counter) / Sum( total <Contract> {< Contract_Type = >} Vehicle_Sales)
- Mark as New
- Bookmark
- Subscribe
- Mute
- Subscribe to RSS Feed
- Permalink
- Report Inappropriate Content
Hello Jonathan,
thanks for your answer and sorry for my late response.
I added a "total" to my Vehicle_Sales formula. This works fine for total views:

However, as soon as I show a detailed view per vehicle type, e.g. in a pivot table, the calculation is wrong for each vehicle type. The amount of contracts for each vehicle type is always divided by the total amount of vehicle sales (regardless of their type):
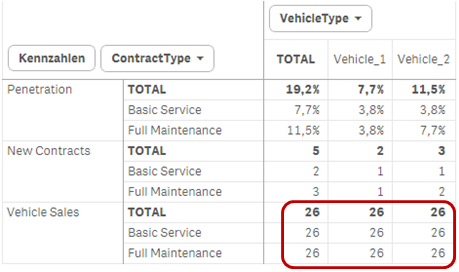
If I select Vehicle_1, the calculation is correct, but without any vehicle selection it is wrong:

I know that one can limit the "total" in the aggregate function like e.g.:

However, if I do so, the result for Vehicle Sales is always Zero and Penetration is "-".
I've created a small demo app which should show the problem, but I do not know how to attach the file.
In this app we have a data model with LINK_TABLE, YearBridge and MasterCalendar. These are needed, because they exist in our "real" app as well (due to 10 different date fields that must be addressed by 1 MasterDate ...and a Date Type):

Does anyone have an idea how to solve this Problem?
How can I attach demo apps?
Thx a lot!