Unlock a world of possibilities! Login now and discover the exclusive benefits awaiting you.
- Qlik Community
- :
- Forums
- :
- Analytics
- :
- App Development
- :
- Re: Total and Percentage In Bar Chart
- Subscribe to RSS Feed
- Mark Topic as New
- Mark Topic as Read
- Float this Topic for Current User
- Bookmark
- Subscribe
- Mute
- Printer Friendly Page
- Mark as New
- Bookmark
- Subscribe
- Mute
- Subscribe to RSS Feed
- Permalink
- Report Inappropriate Content
Total and Percentage In Bar Chart
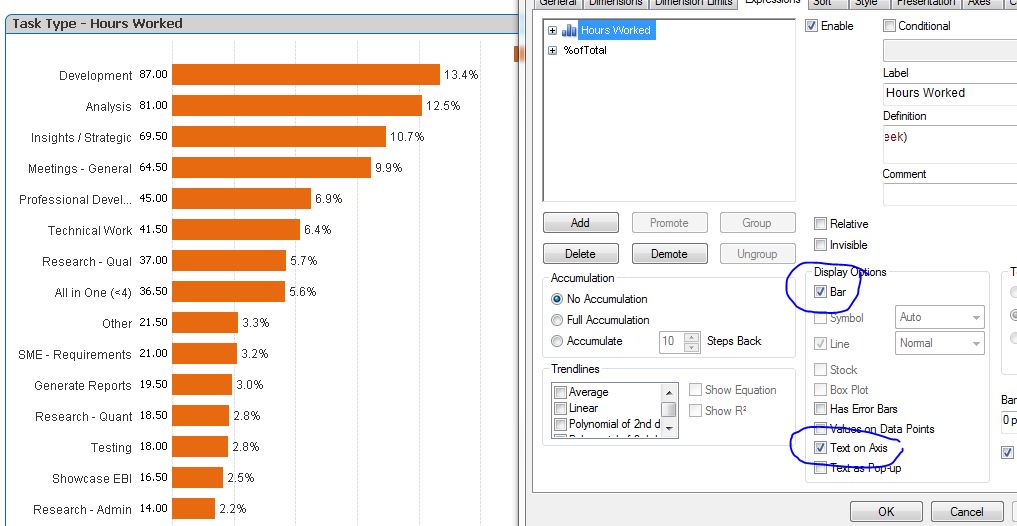
Is it possible in Sense to place both the totals and the percentage of total in a bar graph like you can in Click. In Clikc I would use the Display Options under Expressions to put one to the left of the graph and one at the end of the graph.
- Tags:
- graphs
- Mark as New
- Bookmark
- Subscribe
- Mute
- Subscribe to RSS Feed
- Permalink
- Report Inappropriate Content
I doubt it is possible with Bar chart.
but you can to achieve something similar to this with Combo chart..
- Mark as New
- Bookmark
- Subscribe
- Mute
- Subscribe to RSS Feed
- Permalink
- Report Inappropriate Content
hello,
Maybe you can try using dual?
- Mark as New
- Bookmark
- Subscribe
- Mute
- Subscribe to RSS Feed
- Permalink
- Report Inappropriate Content
Hi,
We end up having 2 alternate measures to deliver something like that. Not ideal, but worked for us. But also worth trying Shraddha's idea with combo chart. good luck!
- Mark as New
- Bookmark
- Subscribe
- Mute
- Subscribe to RSS Feed
- Permalink
- Report Inappropriate Content
Did the combo chart.
1. Can't display a combo chart horizontally only vertically
2. Can't put any values in bar or at end of bar
3. Does allow a dual axis measurement so I can put two measurements on top of each other, best done with bar and line combined.
In short doesn't compare with View ability to chart. Hopefully future releases will allow more control of the graphics.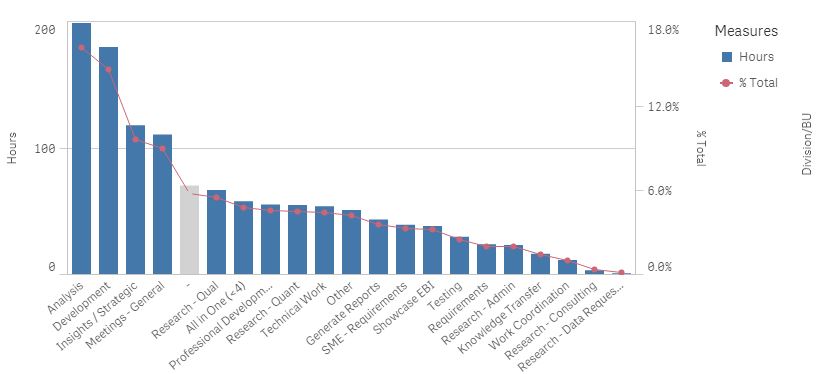
- Mark as New
- Bookmark
- Subscribe
- Mute
- Subscribe to RSS Feed
- Permalink
- Report Inappropriate Content