Unlock a world of possibilities! Login now and discover the exclusive benefits awaiting you.
- Qlik Community
- :
- Forums
- :
- Analytics
- :
- App Development
- :
- Trend line chart - null values
- Subscribe to RSS Feed
- Mark Topic as New
- Mark Topic as Read
- Float this Topic for Current User
- Bookmark
- Subscribe
- Mute
- Printer Friendly Page
- Mark as New
- Bookmark
- Subscribe
- Mute
- Subscribe to RSS Feed
- Permalink
- Report Inappropriate Content
Trend line chart - null values
Hi -
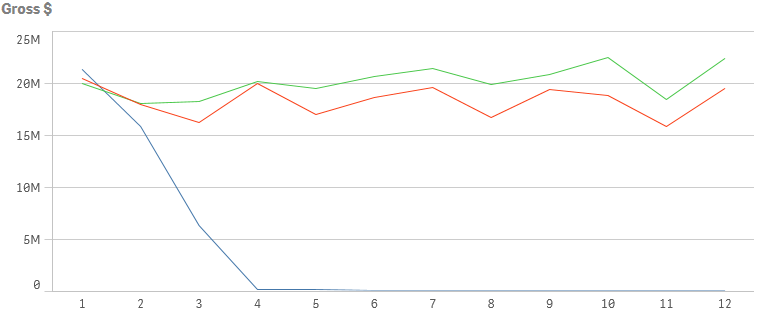
This is my chart. The red and green lines are prior year and budget. I want to show prior year and budget for all 12 months. The blue line represents actuals. I only want the blue line to show through the current month (not display if the value is 0). We are in month 2 of our fiscal year, so it shouldn't show values after month 2, until there are values to show.
Please help! Thank you!
- Mark as New
- Bookmark
- Subscribe
- Mute
- Subscribe to RSS Feed
- Permalink
- Report Inappropriate Content
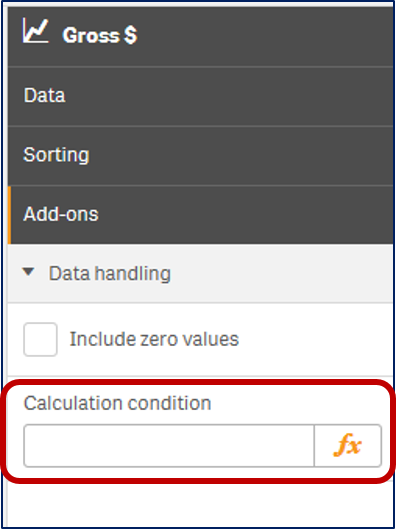
Have you tried looking under "Add-ons" --> Data handling --> and un-checking the "Show zero values" box.

- Mark as New
- Bookmark
- Subscribe
- Mute
- Subscribe to RSS Feed
- Permalink
- Report Inappropriate Content
Yes - I tried that, but It doesn't change the trend line. Is there an expression I can use?
- Mark as New
- Bookmark
- Subscribe
- Mute
- Subscribe to RSS Feed
- Permalink
- Report Inappropriate Content
That calculation condition will just determine if the entire chart should render. It doesn't apply to individual dimensions or measures. Are you able to upload the .qvf file? I'm not sure why the zero or null values are showing.
- Mark as New
- Bookmark
- Subscribe
- Mute
- Subscribe to RSS Feed
- Permalink
- Report Inappropriate Content
Hi Lee - I've been able to make this work with something like the following.
if(isnull([expression to graph])=0,[expression to graph])