Unlock a world of possibilities! Login now and discover the exclusive benefits awaiting you.
- Qlik Community
- :
- Forums
- :
- Analytics
- :
- App Development
- :
- Tricky calculations agregations
- Subscribe to RSS Feed
- Mark Topic as New
- Mark Topic as Read
- Float this Topic for Current User
- Bookmark
- Subscribe
- Mute
- Printer Friendly Page
- Mark as New
- Bookmark
- Subscribe
- Mute
- Subscribe to RSS Feed
- Permalink
- Report Inappropriate Content
Tricky calculations agregations
Hi all,
I try to implement a complex statistic calculation (trust interval) but I fail on an agregation problem :
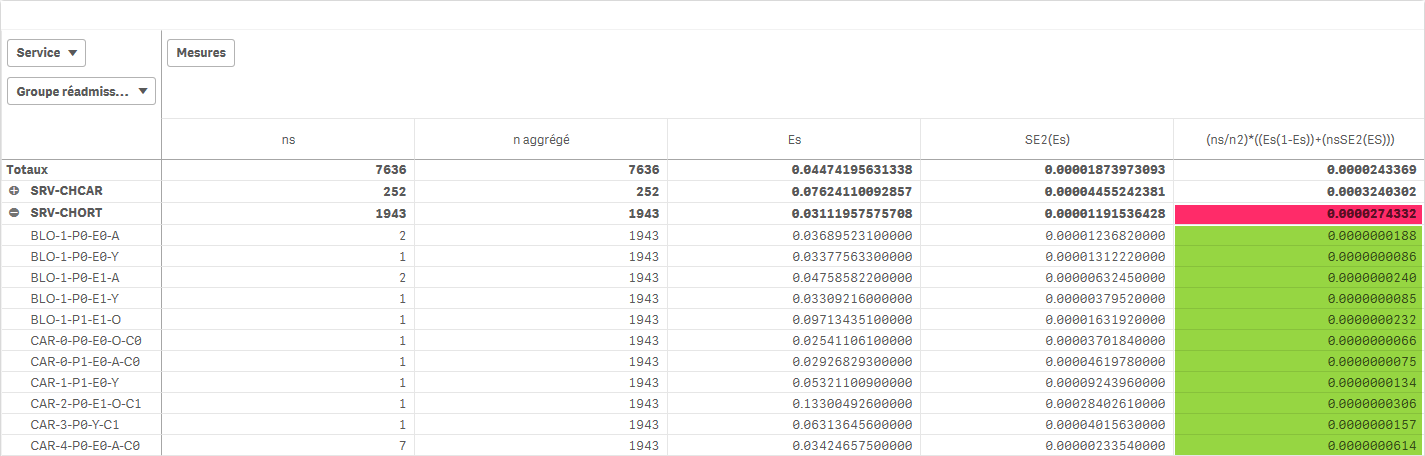
Calculation of the (ns/n2)*((Es(1-Es))+(nsSE2(ES))) column should be done at Groupe réadmission level and should be able to be agregated on all others higher levels, like, here, Service or Département.
Calculation at Groupe réadmission level is ok (in green) and can be automatically agregated but it's impossible to get the right sum at Service level. Result is always wrong (in red).
Here is the formula of the (ns/n2)*((Es(1-Es))+(nsSE2(ES))) column :

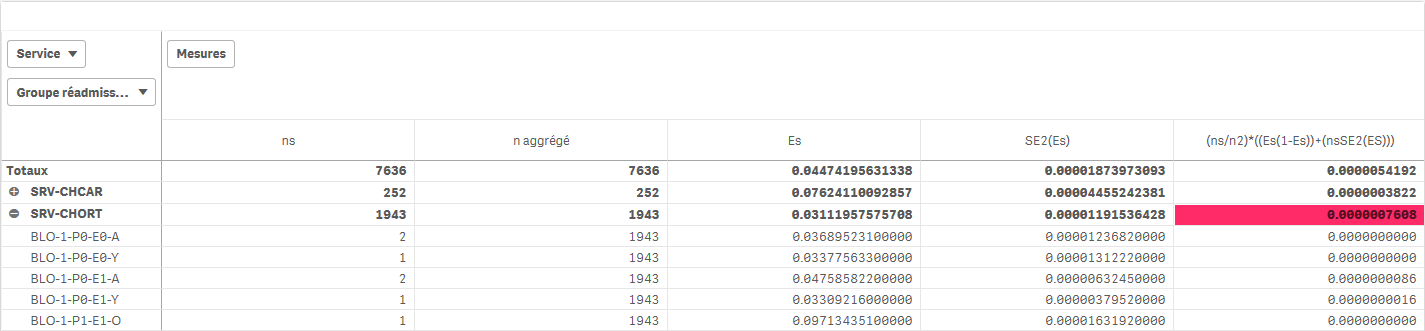
If I do what is the most logic for me : sum(aggr( <the_formula> ,[Groupe réadmission])) then result is different but still wrong :
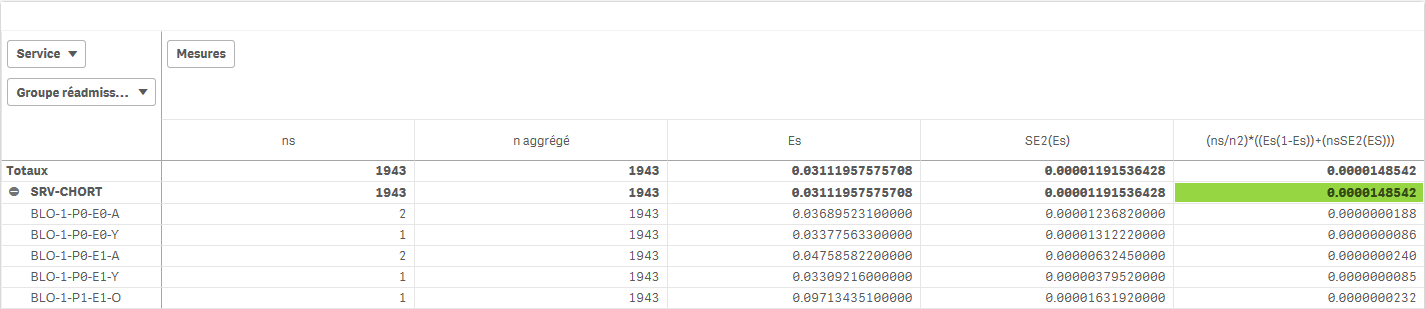
It's correct only if a single Service is selected :
I don't understand. I probably miss something. If someone has an idea, I would be happy to get it.
Many thanks in advance,
Stéphane
Accepted Solutions
- Mark as New
- Bookmark
- Subscribe
- Mute
- Subscribe to RSS Feed
- Permalink
- Report Inappropriate Content
Thank you Sunny.
Yes, you're right. Actually, I tried this but difficulty was that a part of the formula has to be summed over all the dimension.
Finally, I succeeded by adding the upper dimension on witch the sum has to be done in the context and by adding it also on the TOTAL option :
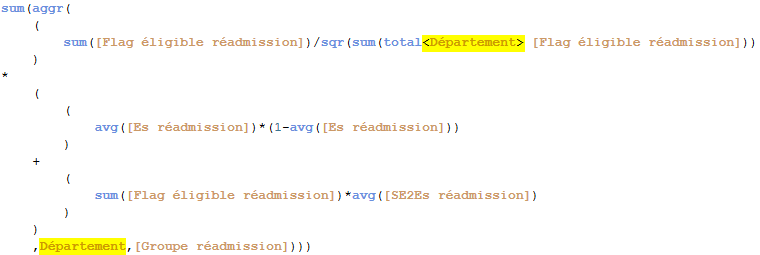
Unfortunatly, this formula can not be agregated on other dimension than the one which is specified so I have to multiply the expressions to have always the one to match where I want to use it. Here is the formula for the Département graph, if I want to make a graph per Service then I have to rewrite another expression with Service instead of Département but ok, that works like that.
Of course, if anyone has a better idea, I would be happy to know it.
Thanks in advance,
Stéphane
- Mark as New
- Bookmark
- Subscribe
- Mute
- Subscribe to RSS Feed
- Permalink
- Report Inappropriate Content
You need to use Sum(Aggr(YourExpression, YourDimensions)) to fix this... also check here
- Mark as New
- Bookmark
- Subscribe
- Mute
- Subscribe to RSS Feed
- Permalink
- Report Inappropriate Content
Thank you Sunny.
Yes, you're right. Actually, I tried this but difficulty was that a part of the formula has to be summed over all the dimension.
Finally, I succeeded by adding the upper dimension on witch the sum has to be done in the context and by adding it also on the TOTAL option :
Unfortunatly, this formula can not be agregated on other dimension than the one which is specified so I have to multiply the expressions to have always the one to match where I want to use it. Here is the formula for the Département graph, if I want to make a graph per Service then I have to rewrite another expression with Service instead of Département but ok, that works like that.
Of course, if anyone has a better idea, I would be happy to know it.
Thanks in advance,
Stéphane
- Mark as New
- Bookmark
- Subscribe
- Mute
- Subscribe to RSS Feed
- Permalink
- Report Inappropriate Content
I think what you have is probably the best you can do.
- Mark as New
- Bookmark
- Subscribe
- Mute
- Subscribe to RSS Feed
- Permalink
- Report Inappropriate Content
I think so too. Thanks anyway Sunny  .
.
Talk to you. Bye !
Stéphane