Unlock a world of possibilities! Login now and discover the exclusive benefits awaiting you.
- Qlik Community
- :
- Forums
- :
- Analytics
- :
- App Development
- :
- Re: Using multiple variables in ValueList that are...
- Subscribe to RSS Feed
- Mark Topic as New
- Mark Topic as Read
- Float this Topic for Current User
- Bookmark
- Subscribe
- Mute
- Printer Friendly Page
- Mark as New
- Bookmark
- Subscribe
- Mute
- Subscribe to RSS Feed
- Permalink
- Report Inappropriate Content
Using multiple variables in ValueList that are AGG() functions
Hello everyone. I'm trying to get a pie chart built in Qlik Sense but I'm having some issues. I've got 2 variables
$(vTest1)
Sum(Aggr(
Only({<scheduleTypeId={7}>} scheduleValue) * Only({<metricId={101}>} hourlyValue)
,masterCalendarDate,locationId))
$(vTest2)
Sum(Aggr(
(Only({<metricId={1}>} hourlyValue) - Only({<scheduleTypeId={7}>} scheduleValue)) * Only({<metricId={102}>} hourlyValue)
,masterCalendarDate,locationId))
And I want to put both of their values into a pie chart. I have the following expression as my Dimension:
ValueList('Test1','Test2')
and my Measure:
if(ValueList('Test1','Test2')='Test1',$(vTest1), $(vTest2))
With the following tables, I'm only seeing the value for Test1 show up in my pie chart
| locationId | masterCalendarDate | metricId | hourlyValue |
|---|---|---|---|
| 43 | 12/31/2015 19:00 | 1 | 10 |
| 43 | 12/31/2015 19:00 | 101 | 1 |
| 43 | 12/31/2015 19:00 | 102 | 9 |
| 43 | 12/31/2015 19:00 | 876 | 8 |
| locationId | masterCalendarDate | scheduleId | scheduleValue |
|---|---|---|---|
| 43 | 12/31/2015 19:00 | 7 | 5 |
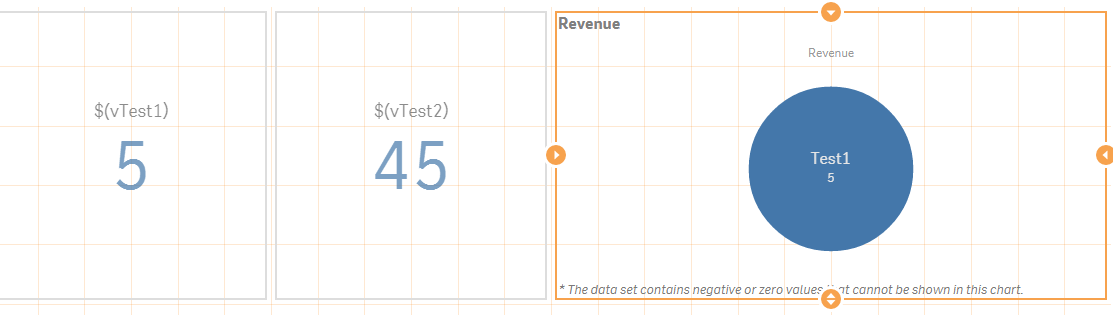
What I'm seeing is that if I put $(vTest1) and $(vTest2) into KPI I get the correct values (5 and 45). But I'm only seeing $(vTest1) in my pie chart. Here is a SS of my sheet. I'm not sure why the Pie Chart says I have negative or zero values since I can see that both are positive values. Any help or advice you've got is greatly appreciated. Thanks!
- « Previous Replies
-
- 1
- 2
- Next Replies »
Accepted Solutions
- Mark as New
- Bookmark
- Subscribe
- Mute
- Subscribe to RSS Feed
- Permalink
- Report Inappropriate Content
Try these:
$(vTest1)
Sum(Aggr(NODISTINCT
Only({<scheduleTypeId={7}>} scheduleValue) * Only({<metricId={101}>} hourlyValue)
,masterCalendarDate,locationId))
$(vTest2)
Sum(Aggr(NODISTINCT
(Only({<metricId={1}>} hourlyValue) - Only({<scheduleTypeId={7}>} scheduleValue)) * Only({<metricId={102}>} hourlyValue)
,masterCalendarDate,locationId))
talk is cheap, supply exceeds demand
- Mark as New
- Bookmark
- Subscribe
- Mute
- Subscribe to RSS Feed
- Permalink
- Report Inappropriate Content
Would you be able to share you application here?
- Mark as New
- Bookmark
- Subscribe
- Mute
- Subscribe to RSS Feed
- Permalink
- Report Inappropriate Content
Here's the .qvf
- Mark as New
- Bookmark
- Subscribe
- Mute
- Subscribe to RSS Feed
- Permalink
- Report Inappropriate Content
Try these:
$(vTest1)
Sum(Aggr(NODISTINCT
Only({<scheduleTypeId={7}>} scheduleValue) * Only({<metricId={101}>} hourlyValue)
,masterCalendarDate,locationId))
$(vTest2)
Sum(Aggr(NODISTINCT
(Only({<metricId={1}>} hourlyValue) - Only({<scheduleTypeId={7}>} scheduleValue)) * Only({<metricId={102}>} hourlyValue)
,masterCalendarDate,locationId))
talk is cheap, supply exceeds demand
- Mark as New
- Bookmark
- Subscribe
- Mute
- Subscribe to RSS Feed
- Permalink
- Report Inappropriate Content
Yup that did it. Can you elaborate on why it wasn't working without NODISTINCT?
- Mark as New
- Bookmark
- Subscribe
- Mute
- Subscribe to RSS Feed
- Permalink
- Report Inappropriate Content
This was the trick, and I'll follow up what Sunny said and ask why we need NODISTINCT here
- Mark as New
- Bookmark
- Subscribe
- Mute
- Subscribe to RSS Feed
- Permalink
- Report Inappropriate Content
To be honest I haven't got the foggiest  . I just figured that using aggr in combination with a synthetic dimension was bound to require some qlikvudu. Oleg will probably say he explains it all in his book and we really really should buy it or attend the Qlik Masters Summit (just kidding Oleg). But perhaps Hernic is willing to explain it for free
talk is cheap, supply exceeds demand
- Mark as New
- Bookmark
- Subscribe
- Mute
- Subscribe to RSS Feed
- Permalink
- Report Inappropriate Content
Qlikvudu 
- Mark as New
- Bookmark
- Subscribe
- Mute
- Subscribe to RSS Feed
- Permalink
- Report Inappropriate Content
How did you know, gwassenaar ? (just kidding 🙂
Sorry, I read it all backwards... so ignore the previous. Here is the real explanation:
AGGR is DISTINCT by default, and by definition is produces a single value for each combination of the dimensions. So, this AGGR will produce one single value for each Location ID and Date.
The chart, however, includes a synthetic dimension "Test", which is not covered in the AGGR(). Out of the two chart lines only one line (the first) gets the single produced value and the second line will get a zero. Adding NODISTINCT makes the AGGR performed at each detailed line and produce multiple results for each combination of the dimensions. This is what makes this formula work in this case.
However, keep in mind that this fix is not universal! In many situations, NODISTINCT can heavily distort your results. I'd say that in those cases when AGGR() needs to be involved, I'd recommend avoiding synthetic dimensions and replacing them with actual Fields. A Field can be added as the extra dimension to the AGGR() function.
And yes, it is discussed in my book, along with demystifying a lot of other mystery around AGGR. And it is surely part of the Masters Summit curriculum. Come and learn, it looks like even the best community experts would have something new to learn from both!
In my book and in my Masters Summit lecture, I call this phenomenon "The third law of AGGR", or "The safe/unsafe use of AGGR() in charts". I dare you to figure out what it means!
cheers,
Oleg
- Mark as New
- Bookmark
- Subscribe
- Mute
- Subscribe to RSS Feed
- Permalink
- Report Inappropriate Content
I do agree, we always need to remember the default DISTINCTness of AGGR() 
Issues with Aggr() and synthetic dimensions (but also with data islands) seem to pop-up sporadically since I am on this forum (no other solutions seen than NODISTINCT and sometimes replacing the valuelist() with a data island and adding the data island dimension field to the aggr() dimensions).
I also think this has something to do with what Henric called a grain mismatch:
It's just hard to understand why this also happens when the expressions uses in fact two different aggregations with two different aggr() functions (but with same aggr() dimensions used on both) for each synthetic dimension line.
Interestingly enough, the issue also appears with only a single aggr() function used, as long it's not appearing in the first dimension line:
=if(ValueList('Test1','Test2')='Test1','Constant', $(vTest2)) // no good
if(ValueList('Test1','Test2')='Test1',$(vTest2),'Constant') // ok
Oleg, I already bought your book, so I need to dig in again to find out why this happens.
Matt: In your specific example, I don't think you need the aggr() functions at all, this should return the same output, since your tables are linked by the relevant fields:
=Only({<scheduleTypeId={7}>} scheduleValue) * Only({<metricId={101}>} hourlyValue)
=(Only({<metricId={1}>} hourlyValue) - Only({<scheduleTypeId={7}>} scheduleValue)) * Only({<metricId={102}>} hourlyValue)
- « Previous Replies
-
- 1
- 2
- Next Replies »