Unlock a world of possibilities! Login now and discover the exclusive benefits awaiting you.
- Qlik Community
- :
- Forums
- :
- Analytics
- :
- App Development
- :
- Values on every measure in stacked bar chart (Qlik...
- Subscribe to RSS Feed
- Mark Topic as New
- Mark Topic as Read
- Float this Topic for Current User
- Bookmark
- Subscribe
- Mute
- Printer Friendly Page
- Mark as New
- Bookmark
- Subscribe
- Mute
- Subscribe to RSS Feed
- Permalink
- Report Inappropriate Content
Values on every measure in stacked bar chart (Qlik Sense)
Hello
I have this stacked bar chart:
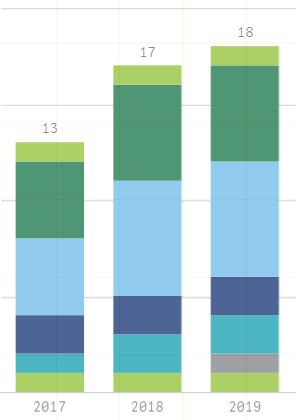
I manage to get only total values shown on the chart. Does anybody know how it would be possible to show values for each measure?
I have the same issue in both cases:
- 2 dimensions, 1 measure
- 1 dimension, 6 measures
Please let me know if you found a workaround.
I attach the app that was used in another discussion for people who would like to try out.
- Mark as New
- Bookmark
- Subscribe
- Mute
- Subscribe to RSS Feed
- Permalink
- Report Inappropriate Content
Hi,
It looks like it will be available in June release.
Andre
- Mark as New
- Bookmark
- Subscribe
- Mute
- Subscribe to RSS Feed
- Permalink
- Report Inappropriate Content
Any news on this issue. It seems to be a common issue. I am stuck on this one at the moment. I don't want to have to go to excel for my users 😞 .
- Mark as New
- Bookmark
- Subscribe
- Mute
- Subscribe to RSS Feed
- Permalink
- Report Inappropriate Content
Hi Patrik,
Where is Qlik in regards to this topic?
We could really use this...
Thanks,
Cory
- Mark as New
- Bookmark
- Subscribe
- Mute
- Subscribe to RSS Feed
- Permalink
- Report Inappropriate Content
When would you anticipate this would roll out?
- Mark as New
- Bookmark
- Subscribe
- Mute
- Subscribe to RSS Feed
- Permalink
- Report Inappropriate Content
Can't believe this basic functionality isn't already included. When can we expect it to be added?!
Pretty fundamental to be able to display the values for each component of a stacked chart.
- Mark as New
- Bookmark
- Subscribe
- Mute
- Subscribe to RSS Feed
- Permalink
- Report Inappropriate Content
Hello @Patrik_Lundblad @Michael_Tarallo ,
I am using April 2019 patch 2 version, still facing this issue.
Any update when can this issue be resolved?
Thanks,
Shabaan
- Mark as New
- Bookmark
- Subscribe
- Mute
- Subscribe to RSS Feed
- Permalink
- Report Inappropriate Content
Hi Shabaan,
This was part of the June 2019 release. So if you upgrade you will get it.
Regards,
Patrik.
- Mark as New
- Bookmark
- Subscribe
- Mute
- Subscribe to RSS Feed
- Permalink
- Report Inappropriate Content
- Mark as New
- Bookmark
- Subscribe
- Mute
- Subscribe to RSS Feed
- Permalink
- Report Inappropriate Content
I have the June 2019 version (qliksensedesktop:13.32.2) and can't seem to find the option to show the values on each section of the stacked bars graph.
Did I misunderstand ?
- Mark as New
- Bookmark
- Subscribe
- Mute
- Subscribe to RSS Feed
- Permalink
- Report Inappropriate Content
Dan