Unlock a world of possibilities! Login now and discover the exclusive benefits awaiting you.
- Qlik Community
- :
- Forums
- :
- Analytics
- :
- App Development
- :
- YTD for comparing multiple years in bar chart
- Subscribe to RSS Feed
- Mark Topic as New
- Mark Topic as Read
- Float this Topic for Current User
- Bookmark
- Subscribe
- Mute
- Printer Friendly Page
- Mark as New
- Bookmark
- Subscribe
- Mute
- Subscribe to RSS Feed
- Permalink
- Report Inappropriate Content
YTD for comparing multiple years in bar chart
This is driving me crazy:
my chart looks like this:
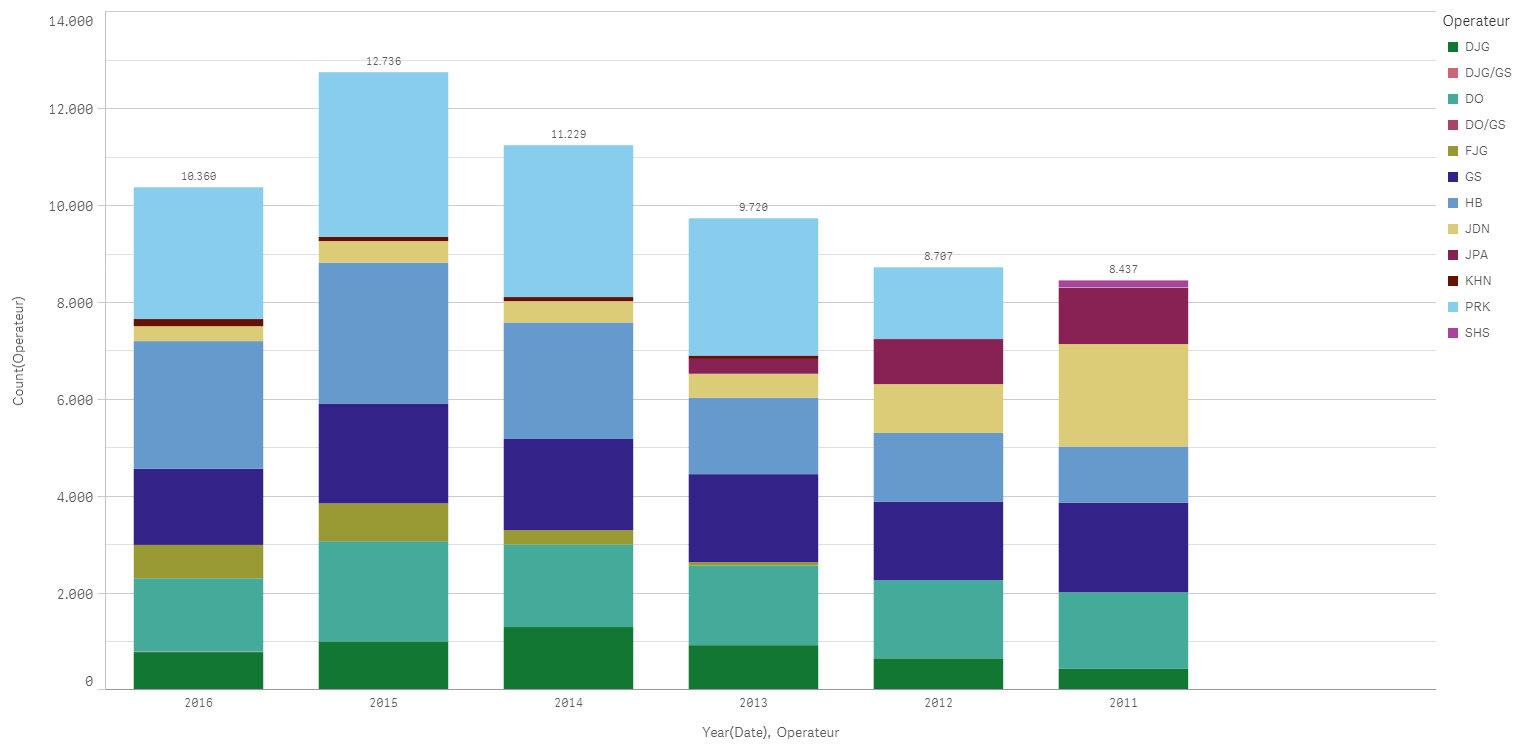
The first dimension is: Year (Date)
Comparison can not be done as 2016 is incomplete, i.e. we are still in 2016.
How do I display data for all years up to the day/month of the last input for the current year (2016)?
I´ve been reading all help files, blogs, etc but could not solve this in three days!!
There seems to be a very convoluted / insanely complicated scripting language in Qlik and the diagrams just don´t look right.
Another thing: why are values not shown in the stacks?? There is enough room!
cheers
Accepted Solutions
- Mark as New
- Bookmark
- Subscribe
- Mute
- Subscribe to RSS Feed
- Permalink
- Report Inappropriate Content
maybe something like
count({$ <Date={"=DayNumberOfYear(Date)<=DayNumberOfYear(Today())"}>} Measure)
- Mark as New
- Bookmark
- Subscribe
- Mute
- Subscribe to RSS Feed
- Permalink
- Report Inappropriate Content
May be create a YTD Flag in the script which goes through the maximum date in the most recent year. May be something like this:
Table:
LOAD Date,
InYearToDate(SetDateYear(Date, Year(Today())), Today(), 0) as YTD_Flag;
LOAD Date(MakeDate(2010, 12, 31) + IterNo()) as Date
AutoGenerate 1
While IterNo() <= Today() - MakeDate(2010, 12, 31);
Here, each year until October 9th the YTD_Flag = -1 and rest of year YTD_Flag = 0. So now in your set analysis, you can just do this:
Sum({<YTD_Flag = {-1}>} Measure)
or this if you wish to further drill down on selections you make
Sum({<YTD_Flag *= {-1}>} Measure)
- Mark as New
- Bookmark
- Subscribe
- Mute
- Subscribe to RSS Feed
- Permalink
- Report Inappropriate Content
If I do the above, Qlik Sense says "invalid Dimension"
I probably put something in the wrong place, so just to repeat:
1) I added the text:
Table:
LOAD Date,
InYearToDate(SetDateYear(Date, Year(Today())), Today(), 0) as YTD_Flag;
LOAD Date(MakeDate(2010, 12, 31) + IterNo()) as Date
AutoGenerate 1
While IterNo() <= Today() - MakeDate(2010, 12, 31);
into the script. I did not put it at the end of the auto-generated load script as I would have to unlock the script and there was a warning that I could not use the data manager when I unlock it and it can not be re-locked again. Instead, I added a new section in the script where I put the above text.
After saving the script, I reloaded my data.
Then I put
Count({<YTD_Flag *= {-1}>} Operateur)
into my field for the second dimension, the first being Year(Date).
When I do that, it says: "error in formula"??
I also tried variations, like
Year({<YTD_Flag *= {-1}>} Date)
and put that into pretty much all boxes that I could find.
Sometimes that would give me an "invalid dimension", at other times an "internal error"
- Mark as New
- Bookmark
- Subscribe
- Mute
- Subscribe to RSS Feed
- Permalink
- Report Inappropriate Content
Why would you put Count() in your dimension? I wanted you to use the set analysis in your expression. Can you try this in your expression?
- Mark as New
- Bookmark
- Subscribe
- Mute
- Subscribe to RSS Feed
- Permalink
- Report Inappropriate Content
maybe something like
count({$ <Date={"=DayNumberOfYear(Date)<=DayNumberOfYear(Today())"}>} Measure)
- Mark as New
- Bookmark
- Subscribe
- Mute
- Subscribe to RSS Feed
- Permalink
- Report Inappropriate Content
Big thank you to Massimo Grossi, that´s it!!!!!