Unlock a world of possibilities! Login now and discover the exclusive benefits awaiting you.
- Qlik Community
- :
- Forums
- :
- Analytics
- :
- App Development
- :
- Re: how to find object usage on a sheet in Qlik Se...
- Subscribe to RSS Feed
- Mark Topic as New
- Mark Topic as Read
- Float this Topic for Current User
- Bookmark
- Subscribe
- Mute
- Printer Friendly Page
- Mark as New
- Bookmark
- Subscribe
- Mute
- Subscribe to RSS Feed
- Permalink
- Report Inappropriate Content
how to find object usage on a sheet in Qlik Sense
Hi All,
Is there a way to track the object usage or to find how many people view or click a certain chart/ sheet object in a Qlik Sense App.
I am trying remove unused graphs and metrics from a Qlik Sense app.
Thanks
Accepted Solutions
- Mark as New
- Bookmark
- Subscribe
- Mute
- Subscribe to RSS Feed
- Permalink
- Report Inappropriate Content
I do not think you can do it in Sense yet.
Performance Monitoring app gives you list of users and access time/session duration, but without additional object-specific details.
VK
- Mark as New
- Bookmark
- Subscribe
- Mute
- Subscribe to RSS Feed
- Permalink
- Report Inappropriate Content
I do not think you can do it in Sense yet.
Performance Monitoring app gives you list of users and access time/session duration, but without additional object-specific details.
VK
- Mark as New
- Bookmark
- Subscribe
- Mute
- Subscribe to RSS Feed
- Permalink
- Report Inappropriate Content
Thanks for the response Vlad
- Mark as New
- Bookmark
- Subscribe
- Mute
- Subscribe to RSS Feed
- Permalink
- Report Inappropriate Content
Sure, no problem.
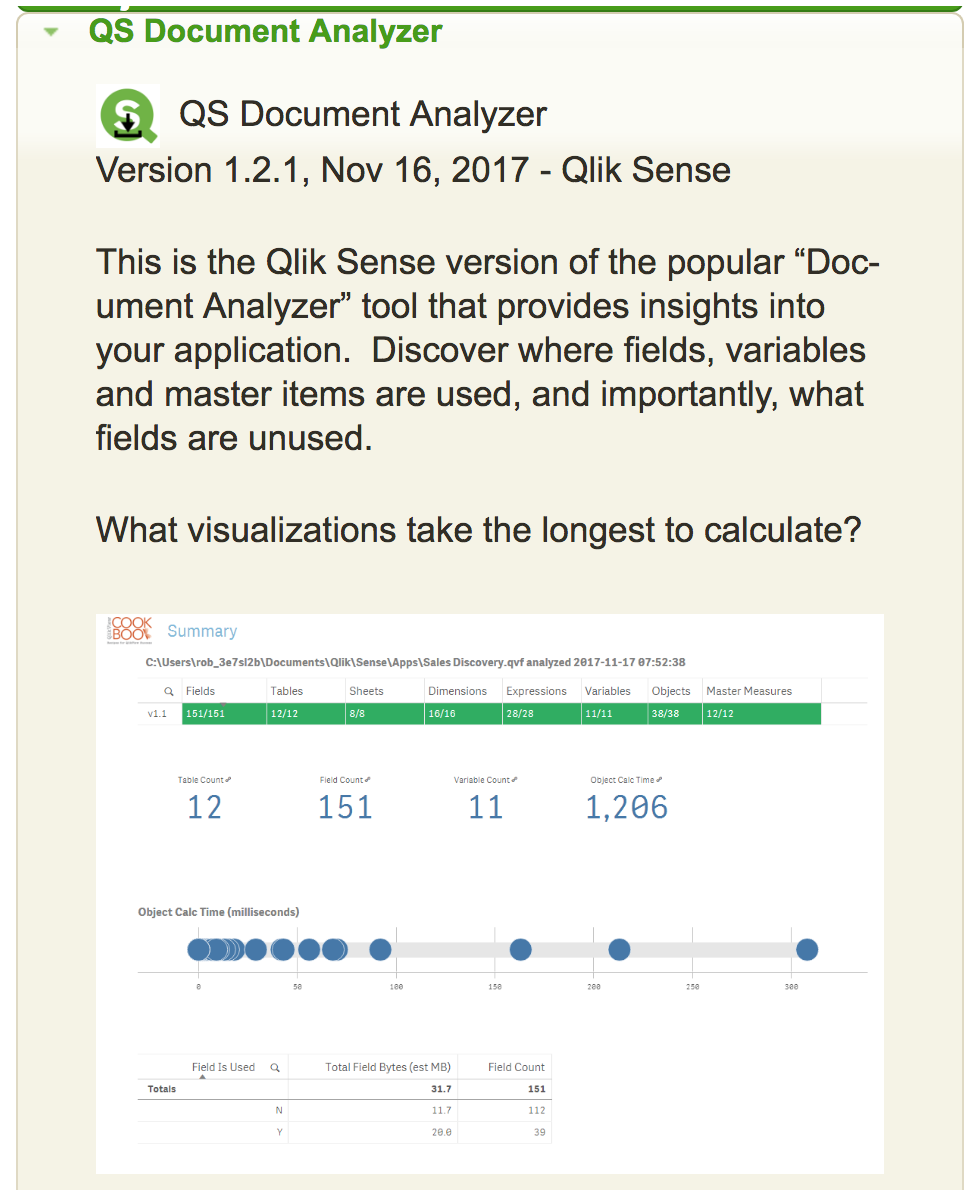
There is a QlikView app developed by Rob Wunderlich, which provides the information you need (and much more) but it's QV-specific.
I hope it will be converted to QS in some point in the future.
VK
- Mark as New
- Bookmark
- Subscribe
- Mute
- Subscribe to RSS Feed
- Permalink
- Report Inappropriate Content
Has this extension made the leap to Sense?
- Mark as New
- Bookmark
- Subscribe
- Mute
- Subscribe to RSS Feed
- Permalink
- Report Inappropriate Content
- Mark as New
- Bookmark
- Subscribe
- Mute
- Subscribe to RSS Feed
- Permalink
- Report Inappropriate Content
Great thanks for checking. It turns out that support for enterprise is not yet available; it's currently only for Desktop. Looking forward to it surfacing on the Qlik branch as an extension to pull into Qlik Sense enterprise.
- Mark as New
- Bookmark
- Subscribe
- Mute
- Subscribe to RSS Feed
- Permalink
- Report Inappropriate Content
Hello, I wanted to clarify, does this tool will track how many times a user accesses a specific sheet in a dashboard? For example, User1 accessed sheet5 in the app 12 times in the month of December.
Or does it just tell you that field1 is used six times through the dashboard.