Unlock a world of possibilities! Login now and discover the exclusive benefits awaiting you.
- Qlik Community
- :
- Forums
- :
- Analytics
- :
- App Development
- :
- Re: metrics name and this year, last year, growth ...
- Subscribe to RSS Feed
- Mark Topic as New
- Mark Topic as Read
- Float this Topic for Current User
- Bookmark
- Subscribe
- Mute
- Printer Friendly Page
- Mark as New
- Bookmark
- Subscribe
- Mute
- Subscribe to RSS Feed
- Permalink
- Report Inappropriate Content
metrics name and this year, last year, growth value
Hello everyone:
I have some metrics, such as metric name 1, metric name2. Now I can use pivot table to display metrics name as first column,
and dimension year as follow colums.
The new pivot table that I want, the first column is metric names, and the second column is this year value, the third column is previous year value, and so on. How can I do it in qlik sense desktop?
Any reply is welcome. Thanks!
- Tags:
- metric name
- Mark as New
- Bookmark
- Subscribe
- Mute
- Subscribe to RSS Feed
- Permalink
- Report Inappropriate Content
I'm not sure what you're asking. Can you post an example in Excel?
talk is cheap, supply exceeds demand
- Mark as New
- Bookmark
- Subscribe
- Mute
- Subscribe to RSS Feed
- Permalink
- Report Inappropriate Content
If I understood correctly, you have your expressions (your metrics / aggregations) pivoted to the left and the year dimension pivoted to the top, right?
You can use calculated dimension or set analysis to limit the year dimension, like (for a calculated dimension)
=If( YearField <= Year( Today() ), YearField)
Then sort your YearField dimension descending and don't show NULL values.
If you want to compare this year's metric with last year's metric, you can use chart inter record functions, like Before() / After() in a pivot table with pivoted dimension (or Above() / Below() with unpivoted dimensions), for example to calculate growth rate for aggregated Metric1 field:
=Sum(Metric1) / After( Sum(Metric1) ) -1
Hope this helps,
Stefan
- Mark as New
- Bookmark
- Subscribe
- Mute
- Subscribe to RSS Feed
- Permalink
- Report Inappropriate Content
![7L`DJ361~LOP(IFUO]Z@EPH.png](/legacyfs/online/119512_7L`DJ361~LOP(IFUO]Z@EPH.png)
When I select some year(only one), my goal is the picture below.
Thank you!
- Mark as New
- Bookmark
- Subscribe
- Mute
- Subscribe to RSS Feed
- Permalink
- Report Inappropriate Content
Thank you !
Because the metric is dynamic, so Sum(Metric1) is not accessable that I think.
- Mark as New
- Bookmark
- Subscribe
- Mute
- Subscribe to RSS Feed
- Permalink
- Report Inappropriate Content
Source data?
talk is cheap, supply exceeds demand
- Mark as New
- Bookmark
- Subscribe
- Mute
- Subscribe to RSS Feed
- Permalink
- Report Inappropriate Content
![_I~PEGB~U[00F4[Q@ZQMZ]V.png](/legacyfs/online/119520__I~PEGB~U[00F4[Q@ZQMZ]V.png)
- Mark as New
- Bookmark
- Subscribe
- Mute
- Subscribe to RSS Feed
- Permalink
- Report Inappropriate Content
Use MetricName as dimension and these three expressions as measures:
- This year: sum({<Year={$(=max(Year))}>}Amount)
- Previous year: sum({<Year={$(=max(Year)-1)}>}Amount)
- Growth: num(sum({<Year={$(=max(Year))}>}Amount)/sum({<Year={$(=max(Year)-1)}>}Amount)-1,'#,##0.0%')
talk is cheap, supply exceeds demand
- Mark as New
- Bookmark
- Subscribe
- Mute
- Subscribe to RSS Feed
- Permalink
- Report Inappropriate Content
Sorry, I mislead you. The metric is some set analysis expression, such as sum({$<item=cost>} amount). The source data is as follows:
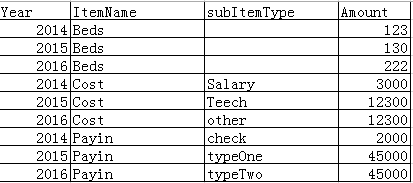
CostMetric = sum({<ItemName={'Cost'}, subItemType={"*"}>}, Amount)
PayinMetric = sum({<ItemName={'Payin'},subItemType={"*"}>},Amount)
BedsMetric = sum({<ItemName={'Beds'}>},Amount)
- Mark as New
- Bookmark
- Subscribe
- Mute
- Subscribe to RSS Feed
- Permalink
- Report Inappropriate Content
Then use a synthetic dimension and use pick-match combinations for each of the three measures. You can find a simple example of such an expression here: Re: How to make expressions look like dimension???
talk is cheap, supply exceeds demand