Unlock a world of possibilities! Login now and discover the exclusive benefits awaiting you.
- Qlik Community
- :
- Forums
- :
- Analytics
- :
- App Development
- :
- need help with creating trend graph
Options
- Subscribe to RSS Feed
- Mark Topic as New
- Mark Topic as Read
- Float this Topic for Current User
- Bookmark
- Subscribe
- Mute
- Printer Friendly Page
Turn on suggestions
Auto-suggest helps you quickly narrow down your search results by suggesting possible matches as you type.
Showing results for
Not applicable
2015-06-22
09:58 AM
- Mark as New
- Bookmark
- Subscribe
- Mute
- Subscribe to RSS Feed
- Permalink
- Report Inappropriate Content
need help with creating trend graph
Hi, All.
New to Qlik and trying to learn to use Qlik Sense. Need help trying to create a trend graph.
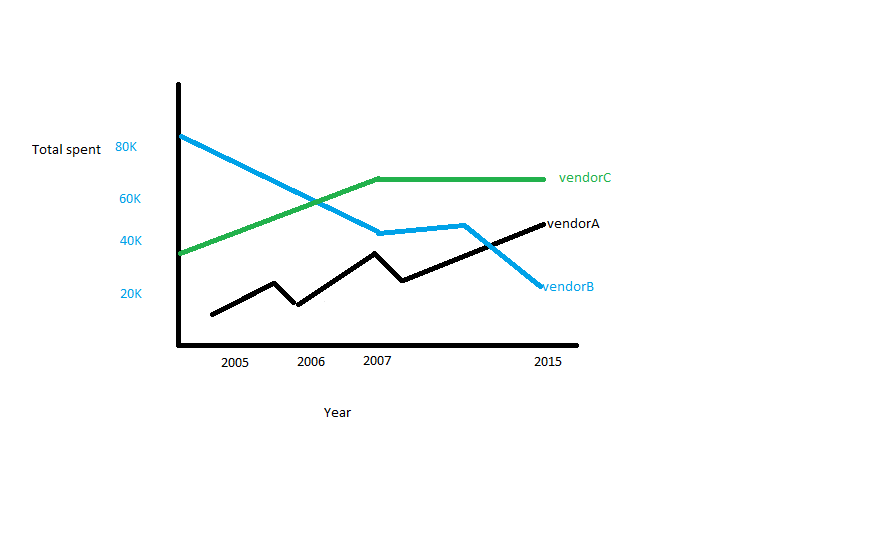
I have a dataset of individual spending transactions for various vendors from 2005 - 2015. I want to create a trend graph for
spending trends for the top three vendors from 2005 - 2015. Would appreciate any help on how I would go about doing this.
Thanks.
242 Views
0 Replies
Community Browser