Unlock a world of possibilities! Login now and discover the exclusive benefits awaiting you.
- Qlik Community
- :
- Forums
- :
- Analytics
- :
- App Development
- :
- qlik sense stacked bar chart color expression
- Subscribe to RSS Feed
- Mark Topic as New
- Mark Topic as Read
- Float this Topic for Current User
- Bookmark
- Subscribe
- Mute
- Printer Friendly Page
- Mark as New
- Bookmark
- Subscribe
- Mute
- Subscribe to RSS Feed
- Permalink
- Report Inappropriate Content
qlik sense stacked bar chart color expression
Hi
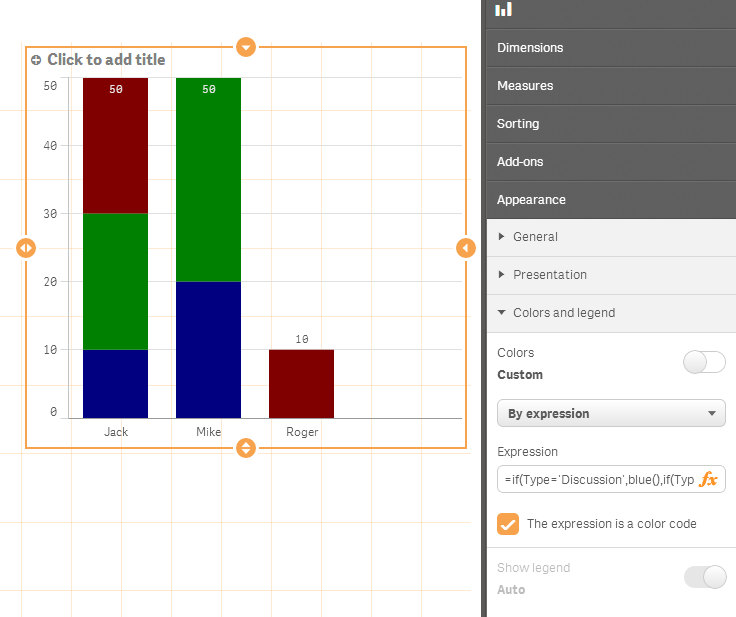
I have a stacked bar chart.my data looks like below.My stack bar contains Discussion, replies,wiki per author. I want to use blue color for Discussion, green for replies, red for wikis something like that. How do i write expression for this scenario and if i use custom expression does legend appear ?
Can you please help on this
Author Type Count
Jack DIscussion 10
Mike Discussion 20
Mike Replies 30
Roger Wiki 10
Jack Wiki 20
Jack Replies 20
Thanks
Accepted Solutions
- Mark as New
- Bookmark
- Subscribe
- Mute
- Subscribe to RSS Feed
- Permalink
- Report Inappropriate Content
- Mark as New
- Bookmark
- Subscribe
- Mute
- Subscribe to RSS Feed
- Permalink
- Report Inappropriate Content
Hi Vamsi,
Try the custom expression like "if(Type='Discussion',blue(),if(Type='Replies',Green(),Red()))"
By default when you use custom expression the legend wont appear...
If you want the legend to appear then go by the custom color by dimension - type
Hope this helps
Thanks,
Vignesh
- Mark as New
- Bookmark
- Subscribe
- Mute
- Subscribe to RSS Feed
- Permalink
- Report Inappropriate Content
Hi
Thanks for reply. I tried and i am not getting desired behavior. Did you use anything for measures. Did you add Type as measure or anything specific?
I am always getting Last mentioned color. I believe i am doing something wrong in measures so that my expression is not recognizing.
- Mark as New
- Bookmark
- Subscribe
- Mute
- Subscribe to RSS Feed
- Permalink
- Report Inappropriate Content
PFA
- Mark as New
- Bookmark
- Subscribe
- Mute
- Subscribe to RSS Feed
- Permalink
- Report Inappropriate Content
Thanks. I did mistake when forming stacked chart. Thanks for help giving qvf