Unlock a world of possibilities! Login now and discover the exclusive benefits awaiting you.
- Qlik Community
- :
- Forums
- :
- Analytics
- :
- App Development
- :
- question
- Subscribe to RSS Feed
- Mark Topic as New
- Mark Topic as Read
- Float this Topic for Current User
- Bookmark
- Subscribe
- Mute
- Printer Friendly Page
- Mark as New
- Bookmark
- Subscribe
- Mute
- Subscribe to RSS Feed
- Permalink
- Report Inappropriate Content
question
Hi,
I am working with pivot table i want color to my data according to the highest spent and lowest spent amount.
e.g over spending ranges from >= 1000000 color green() under spending is <1000000 color red()
How do I create the expression.
| PROJECT ID | BUDGET | ACTUAL BUDGET | CONSUMED AMOUNT | AVAILABLE BALANCE | Header 6 | Header 7 |
|---|---|---|---|---|---|---|
001 | 20000000 | 30000000 | 10000000 | 400000 | ||
| 003 | 500000 | 14000000 | 567990 | 600000 | ||
| 002 | 4500000 | 20000000 | 2760000 | 100590 | ||
| 009 | 3000000 | 2504500 | 3210000 | 471230 | ||
| 006 | 15000000 | 5680000 | 160000 | 5000 | ||
| 007 | 12000000 | 34600000 | 1230000 | 45890 | ||
| 005 | 500000 | 23333333 | 1000000 | 200001 | ||
| 010 | 160000 | 67777555 | 60000 | 6600 |
- Tags:
- saran
- Mark as New
- Bookmark
- Subscribe
- Mute
- Subscribe to RSS Feed
- Permalink
- Report Inappropriate Content
Hi,
Pivot table property has one tab named "Visual Cues" you can define the upper value and lower value and as per the value you can define the color and other formatting also.
Regards,
Kaushik Solanki
- Mark as New
- Bookmark
- Subscribe
- Mute
- Subscribe to RSS Feed
- Permalink
- Report Inappropriate Content
How do i do that please
- Mark as New
- Bookmark
- Subscribe
- Mute
- Subscribe to RSS Feed
- Permalink
- Report Inappropriate Content
1. Right Click on the Pivot Table.
2. Click on Properties
3. Go to Tab "Visual Cues"
4. Enter upper value as "1000000".
5. Select Background color for that as Greeen.
6. Enter Lower value as "1000000".
7. Select Background color for that as Red.
8. Click on Apply.
9. Click on Ok.
Regards,
Kaushik Solanki
- Mark as New
- Bookmark
- Subscribe
- Mute
- Subscribe to RSS Feed
- Permalink
- Report Inappropriate Content
@kaushik solanki
when i right click i cant get the option on Visual Cues
- Mark as New
- Bookmark
- Subscribe
- Mute
- Subscribe to RSS Feed
- Permalink
- Report Inappropriate Content
Hi,
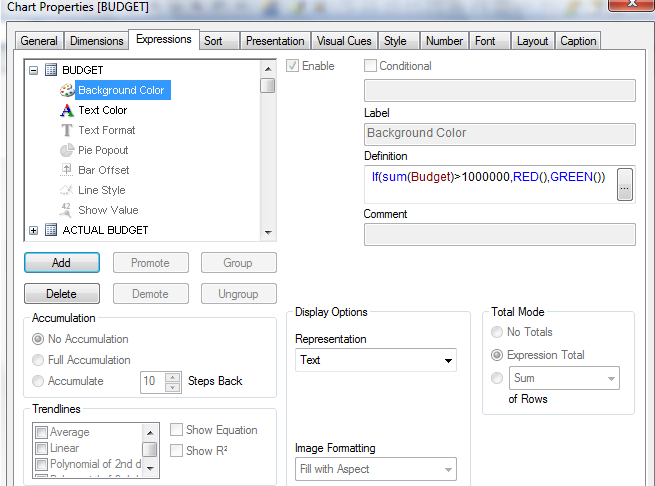
you can update the condition here to say if amount is greater than something color it in this way.
- Mark as New
- Bookmark
- Subscribe
- Mute
- Subscribe to RSS Feed
- Permalink
- Report Inappropriate Content
Attaching a test copy for your reference. Here I have added expression to highlight background color and text color based on Budget amount.
You can update these expression on the fields of your choice. ! !
- Mark as New
- Bookmark
- Subscribe
- Mute
- Subscribe to RSS Feed
- Permalink
- Report Inappropriate Content
hey is this Qlik sense desktop? am using qlik sense desktop
I want the colors to appear on all the 4 columns.
- Mark as New
- Bookmark
- Subscribe
- Mute
- Subscribe to RSS Feed
- Permalink
- Report Inappropriate Content
Oops.. It's not qliksense.. I added Qlikview document.
Please follow this QlikSense - pivot table - change color of cell vs average of grouping
This can be achieved in more or less similar way in Qliksense.
- Mark as New
- Bookmark
- Subscribe
- Mute
- Subscribe to RSS Feed
- Permalink
- Report Inappropriate Content
one link from Qliksense help as well.
http://help.qlik.com/en-US/sense/3.2/Subsystems/Hub/Content/Colors/color-by-expression.htm