Unlock a world of possibilities! Login now and discover the exclusive benefits awaiting you.
- Qlik Community
- :
- All Forums
- :
- Deployment & Management
- :
- Showing other values in a bar chart
Options
- Subscribe to RSS Feed
- Mark Topic as New
- Mark Topic as Read
- Float this Topic for Current User
- Bookmark
- Subscribe
- Mute
- Printer Friendly Page
Turn on suggestions
Auto-suggest helps you quickly narrow down your search results by suggesting possible matches as you type.
Showing results for
Anonymous
Not applicable
2018-06-06
01:30 PM
- Mark as New
- Bookmark
- Subscribe
- Mute
- Subscribe to RSS Feed
- Permalink
- Report Inappropriate Content
Showing other values in a bar chart
Hello all,
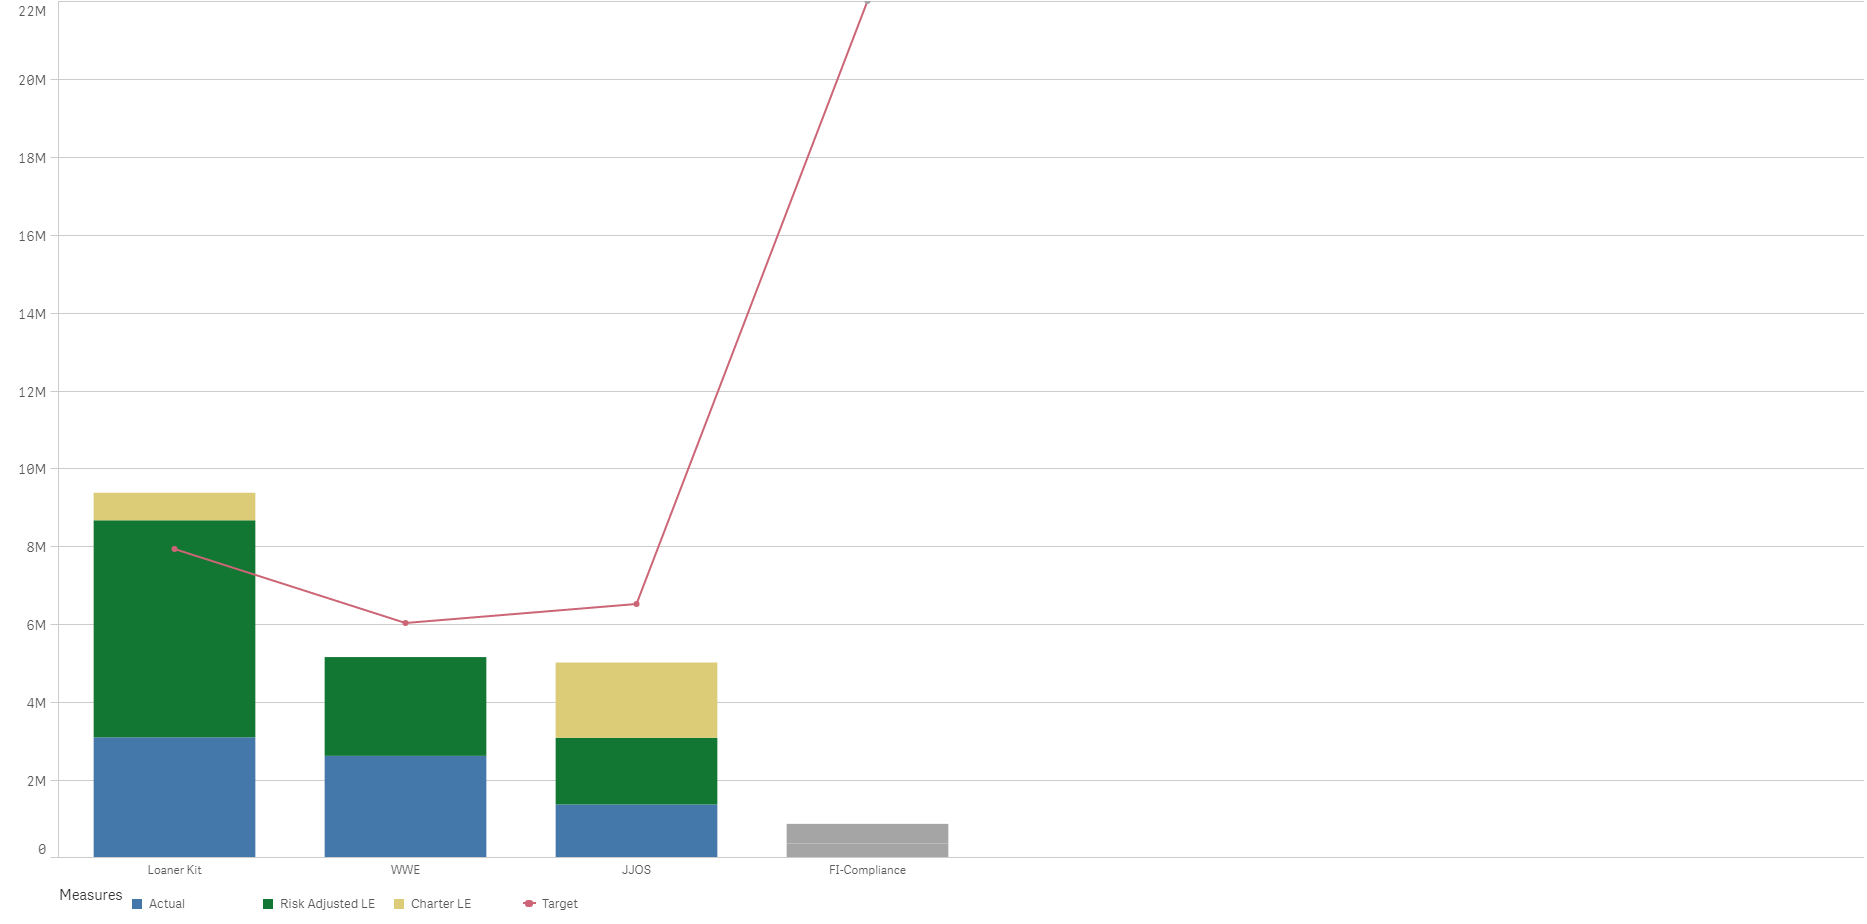
In my dashboard, I took the top 3 measures, and grouped the rest in "show others". In the show others category, they are all greyed out unlike the rest of the chart.
Is there a way I can group them and they show the colors just like the rest of the chart? Here is a picture for reference: Thanks in advance!
315 Views
0 Replies