Unlock a world of possibilities! Login now and discover the exclusive benefits awaiting you.
- Qlik Community
- :
- All Forums
- :
- Deployment & Management
- :
- problem with a pivot table and set analysis
- Subscribe to RSS Feed
- Mark Topic as New
- Mark Topic as Read
- Float this Topic for Current User
- Bookmark
- Subscribe
- Mute
- Printer Friendly Page
- Mark as New
- Bookmark
- Subscribe
- Mute
- Subscribe to RSS Feed
- Permalink
- Report Inappropriate Content
problem with a pivot table and set analysis
Hello I have a pivot table and i would like to display the average of Sum(Taux) but i have a wrong value :
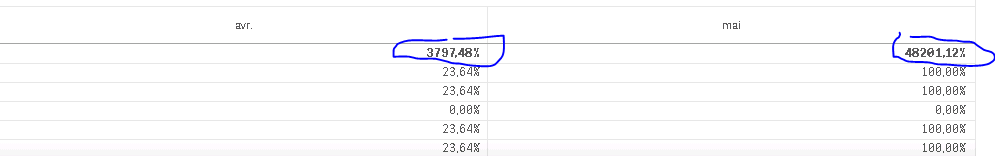
for example in avr i must have a value near to 23,64% and in mai i need to have a value close to 100%
and this is the set analyses used for this
if(Dimensionality()=1, Avg(Aggr(Sum(Taux), Plaque_flotte)),sum(Taux))
Regards
- Mark as New
- Bookmark
- Subscribe
- Mute
- Subscribe to RSS Feed
- Permalink
- Report Inappropriate Content
Can you try this
Avg(Aggr(Sum(Taux), Plaque_flotte))
- Mark as New
- Bookmark
- Subscribe
- Mute
- Subscribe to RSS Feed
- Permalink
- Report Inappropriate Content
Hello Sunny,

this is the result of your set analysis there is no values in mai and the value in avr are wrong...
- Mark as New
- Bookmark
- Subscribe
- Mute
- Subscribe to RSS Feed
- Permalink
- Report Inappropriate Content
Would you be able to share a sample?
- Mark as New
- Bookmark
- Subscribe
- Mute
- Subscribe to RSS Feed
- Permalink
- Report Inappropriate Content
You have three dimensions in your chart
Avg(Aggr(Sum(Taux), Plaque_flotte, Dimension2, Dimension3))
I saw that your dimension3 (month) is a calculation... carry that out in the script and use that here
- Mark as New
- Bookmark
- Subscribe
- Mute
- Subscribe to RSS Feed
- Permalink
- Report Inappropriate Content
yes i do this but the average is still wrong ...

- Mark as New
- Bookmark
- Subscribe
- Mute
- Subscribe to RSS Feed
- Permalink
- Report Inappropriate Content
Did you take your third dimension to the script?
Month(Date) as Month? and use Month in the aggr() function