If you build BI frontends you probably meet a challenge to visualize measures not knowing if they are in thousands or millions. Beacuse of that some posts about formatting these kinds of measures (above all because of KPIs) has been written already. I decided to spend some minutes on my own to find the solution and here it is.
Problem we want to solve:
- We do not know if the measure will be in hundreds, thousands or millions
- Final measure should consists of maximum 3 characters before and 2 after the decimal separator
- Final measure should contain unit of measure in text form
If you wonder only about the solution feel free to scroll to the end  .
.
Let’s try to figure it out in logic steps (in case of this example we use simple sum(Value) as a measure):
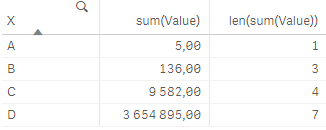
1. We intuitively class numbers into units, thousands and millions. The difference between thousand and one is 3 more numbers. The difference between million and thousand is 3 more numbers, too. It is obvious that the crucial aspect is the length of a measure – in multiples of 3:
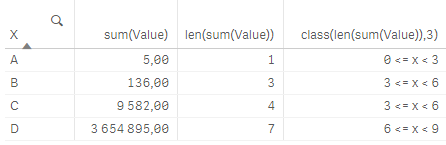
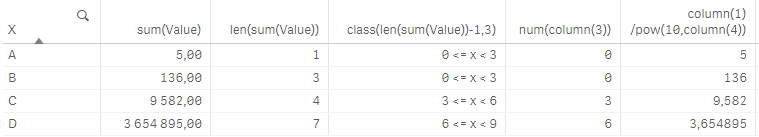
2. Since before the delimiter we want to have only up to 3 numbers values that consists of up to 3 characters (0-999) should stay unchanged, thousands (4-6 characters) should be divided by 1 000 and millions (7-9 characters) by 1 000 000. It seems as a work for class() function. However, if we use it just in simple way class(len(sum(Value)),3) the result is:
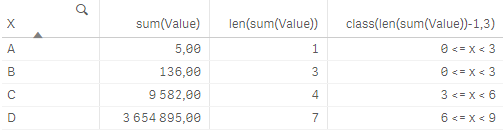
3. We can see that value 136 (which we do not want to change) is in the same class as value 9 582 which should be divided. This leads us to a small modification of the class function class(len(sum(Value))-1,3):
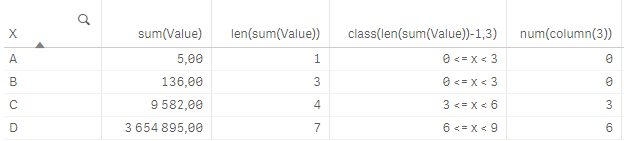
4. Class() function is dual so except for the text presentation 3 <= x < 6 we can refer to the left interval’s border by using another function num(class()):
5. The factor we want to use for dividing of thousands is of course 1 000 = pow(10,3) and for millions 1 000 000 = pow(10,6). Values smaller than one thousand do not need to be modified but we can divide them by 1 which is nothing else then pow(10,0). In general we have the function:
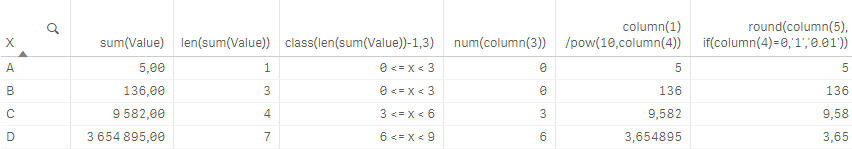
6. Let’s look at decimal places. As we focus on details we know that if the value has not been divided (and is the whole number) then we do not have to write anything after decimal separator (this depends on your data - if you have the raw data in decimals then you need to probably use only general function round(*,'0.01')):
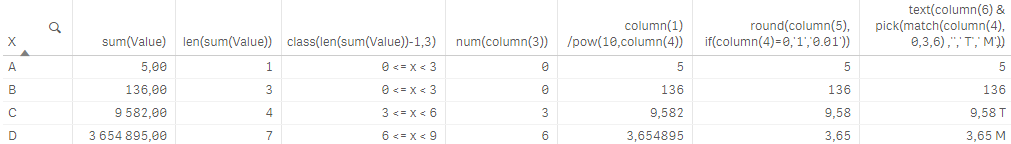
7. By using the same logic as we define the power of 10 that should be used for dividing the value we can assign the text of corresponding unit to the measure:
8. When we add together everything we have done in previous steps our expression will look like this:
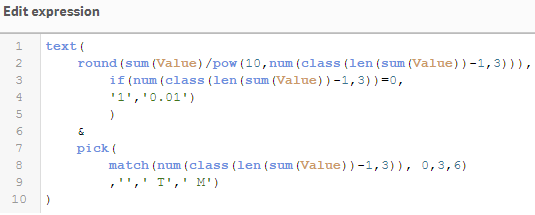
... it makes sense - qlik makes it ... 
Maria
 .
.