Unlock a world of possibilities! Login now and discover the exclusive benefits awaiting you.
- Qlik Community
- :
- Forums
- :
- Forums by Product
- :
- Products (A-Z)
- :
- Qlik Sense
- :
- Documents
- :
- Makes Sense to go round in circles
- Edit Document
- Move Document
- Delete Document
- Subscribe to RSS Feed
- Mark as New
- Mark as Read
- Bookmark
- Subscribe
- Printer Friendly Page
- Report Inappropriate Content
Makes Sense to go round in circles
- Move Document
- Delete Document and Replies
- Mark as New
- Bookmark
- Subscribe
- Mute
- Subscribe to RSS Feed
- Permalink
- Report Inappropriate Content
Makes Sense to go round in circles
I’ve seen a lot of questions recently from people with backgrounds in Qlik View identifying some features that they use a lot in View but are currently not supported in QlikSense.
In this document I will show you how with the use of an extension you can mimic the behaviour of a Cyclic Group in Sense. I've also attached a working example.
Big thanks to View Profile: erikwett - Qlik Branch and his qsVariable extension that made this possible. It dug me out of a hole where my clients users were asking for the same charts from different points of view.
18/01/2016 Update
I've an update Cyclic Group example to resolve an annoying by product of the cyclical filter example I've given in regard to the label that's displayed in the filter bar.
Big thanks to vadimtsushko for pointing out the solution which makes filtering on this a lot easier for the user to understand.
instead of showing the expression used to determine which value to group on in the filter bar, which is messy and confusing to the user. It now shows the value selected in the filter bar.
02/01/2018 Update
As of November release we now have the ability to update the labels of Dimensions and Measures dynamically as i've shown in the new sample app, before I had to hide or generalize the label which was a bit of a fudge.
Although you can add cyclical filters into individual charts via alternative dimensions already I still feel this is a valid soluton for those with a use case needing to display the users selection over multiple charts and sheets at once.
Hope this makes sense.
Andy
- Move Comment
- Delete Comment
- Mark as Read
- Mark as New
- Bookmark
- Permalink
- Report Inappropriate Content
Hi Andy
Thank you for your sharing. By the way your solution need extension ?
Paul Yeo
DIrector
TDS Technology (S) P/L
Whatsapp +65 9326 1804
www.tdstech.com<http://www.tdstech.com>
- Move Comment
- Delete Comment
- Mark as Read
- Mark as New
- Bookmark
- Permalink
- Report Inappropriate Content
Hi Andy,
Need your help, I want open this discussion until resolve my issue. !
it shows last measure (qty) by default. not changing on button click. ! even if you see your qvf. cyclic Group.qvf. this is only showing last button ( month). if you select company or product, graph is not changing.
Regards
Ajeet
- Move Comment
- Delete Comment
- Mark as Read
- Mark as New
- Bookmark
- Permalink
- Report Inappropriate Content
Yes currently Qlik doesn't have an out the box button/slider/dropdown for variable setting and control.
I've used QSVariable for mine but since then Branch has had lots of control objects included for use in this solution.
Regards
Andy
- Move Comment
- Delete Comment
- Mark as Read
- Mark as New
- Bookmark
- Permalink
- Report Inappropriate Content
What version of Sense are you on? I know 3.2 had issues that broke some extensions. if you go to branch their is a new version of qsvariable to download and install.
- Move Comment
- Delete Comment
- Mark as Read
- Mark as New
- Bookmark
- Permalink
- Report Inappropriate Content
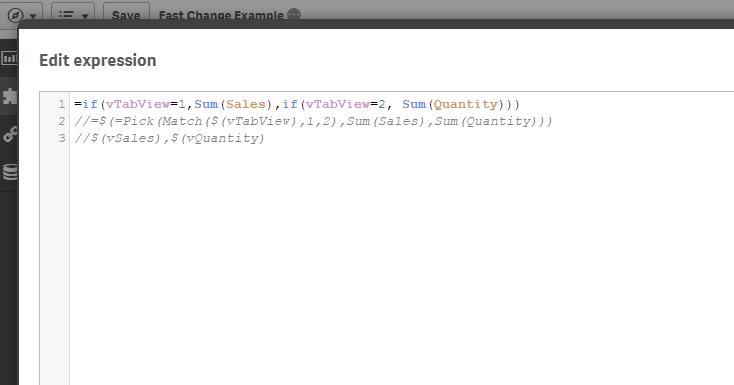
Fast change Dimension or measure on button selection
I opened this fresh discussion. kindly see my way of requirement, I used your app.
yes it's 3.2 SR4 and I downloaded qsvariable extension yesterday.
Regards
Ajeet
- Move Comment
- Delete Comment
- Mark as Read
- Mark as New
- Bookmark
- Permalink
- Report Inappropriate Content
Paul, your qvf shows 2 charts showing sales and quantity separately. in my case, I want to change expression on button click. I am sharing a link. Please see
Fast change Dimension or measure on button selection
Regards
Ajeet
- Move Comment
- Delete Comment
- Mark as Read
- Mark as New
- Bookmark
- Permalink
- Report Inappropriate Content
Hi Ajeet
I have download your QVF file and it work fine. Thank you for sharing with you your solution. But I am looking for solution with out using the extension.
Paul Yeo
- Move Comment
- Delete Comment
- Mark as Read
- Mark as New
- Bookmark
- Permalink
- Report Inappropriate Content
Paul, request you please respond on my thread
Fast change Dimension or measure on button selection
my app is not working as requirement. graph is not changing on button select. in my knowledge there is no solution in QS without extension.
Regards
Ajeet
- Move Comment
- Delete Comment
- Mark as Read
- Mark as New
- Bookmark
- Permalink
- Report Inappropriate Content
Button is only showing sales bcz I passed 1 when created variable. If I do not pass any value, you do not see any value in your graph. in your app as well you passed 3 that's why only Month is showing and no selection is working on Button.


- Move Comment
- Delete Comment
- Mark as Read
- Mark as New
- Bookmark
- Permalink
- Report Inappropriate Content
This is a superb answer!
Thanks,
Craig Bolton
- « Previous
- Next »