Unlock a world of possibilities! Login now and discover the exclusive benefits awaiting you.
- Qlik Community
- :
- Forums
- :
- Forums by Product
- :
- Products (A-Z)
- :
- Qlik Sense
- :
- Documents
- :
- Qlik Alerting Monitoring App setup instructions
- Edit Document
- Move Document
- Delete Document
- Subscribe to RSS Feed
- Mark as New
- Mark as Read
- Bookmark
- Subscribe
- Printer Friendly Page
- Report Inappropriate Content
Qlik Alerting Monitoring App setup instructions
- Move Document
- Delete Document and Replies
- Mark as New
- Bookmark
- Subscribe
- Mute
- Subscribe to RSS Feed
- Permalink
- Report Inappropriate Content
Qlik Alerting Monitoring App setup instructions
The Qlik Alerting September 2020 release includes a new Qlik Sense monitoring app that will allow you to better understand what is happening with your Qlik Alerting environment. This will enable you to see the load on the system, the average processing times, the reason why an alert may not have been sent to the recipient and other information.
We have added a few shortcuts for you to get the data connections setup appropriately. Please follow the steps below to get the monitoring app setup:
Setting up the Data Connectors in Qlik Sense.
This is a little detailed to setup manually so we have added a .bat file in the installer to push the connections using the correct attributes from your Qlik Alerting installation. You need to have completed the registration process if this is a new install of Qlik Alerting as this process will use the data source and Qlik Alerting config settings to create the data connectors.
Steps to follow:
- On the Qlik Alerting server, navigate to the C:\Program Files\Qlik Alerting\setup\monitoring-connection folder
- Double click the connections.bat file to run
- The process will offer and explanation and then will prompt you to enter a username and password. These are the username and password you use to logon (as an administrator) to Qlik Alerting.
- Check the Qlik Sense QMC and you should see two new data connections monitor_alerting and monitor_alerting_login
Import and reload the Qlik Alerting Monitoring Qlik Sense application
Once the connections have been created you can now import the Qlik Sense application that can be found in the C:\Program Files\Qlik Alerting\setup\monitoring-connection folder.
Steps to follow:
- In the Qlik Sense QMC, import the Qlik Sense application that can be found in the C:\Program Files\Qlik Alerting\setup\monitoring-connection folder. This file is called Qlik Alerting Monitoring.qvf
- Open the application in the Qlik Sense Hub and go to the Data Load Editor view
- In the Set Load Details tab of the script find the vServer variable and enter your Qlik Alerting server details,
e.g. https://QlikAlertingServerName.Comapny.com:4552 - Click reload to test the connections work appropriately.
Troubleshooting
If the reload does not work straight away here are a few things to check:
- Check you have entered the correct Qlik Alerting user credentials when creating the data connections. You can validate this by looking at the monitor_alerting_login connection and checking the username and password in the URL. They will be surrounded by %3 (encoded quotes) so please do not remove these.
- Check that the URL is correct in the data connection. The URL entered into the data connection comes from the Qlik Alerting config step where you enter the hast of the Qlik Alerting server. It is possible that you have not entered the fully qualified domain name here and will need to manually change this in the URLs of both the data connections.
- Check that you have entered the correct fully qualified server name and port in the vServer variable in the script of the Qlik Alerting Monitoring Qlik Sense application. This is a manual step as we do not insert this during the data connection process.
Optional: Steps to create the data connections manually
If you really cannot follow the simple steps above to create the data connections, for security reasons for example, you can follow the instructions below to create them manually.
Setup the monitor_alerting_login data connection
This request makes the authentication request to Qlik Alerting and is required to get the authenticated session token to run the monitor_alerting api connections to actually retrieve the data.
- In Qlik Sense, create a new app in your my work area just to create and test the connections.
- Navigate to the data load editor.
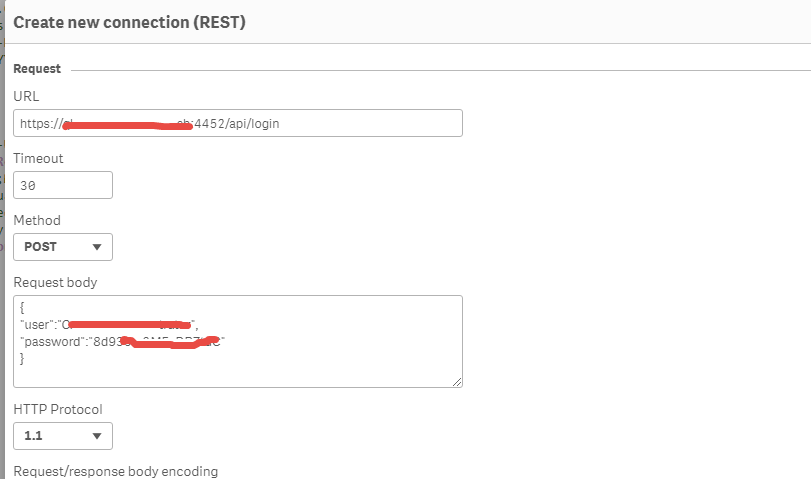
- Create a new data connection using the REST data connection type
Enter the URL updating your <QA_Server> and <QA_https_port> values
https://<QA_Server>:<QA_https_port>/api/login
- Change the Method option to POST
In the body section that appears enter the following details adding your user and password as you would use to login to the Qlik Alerting portal
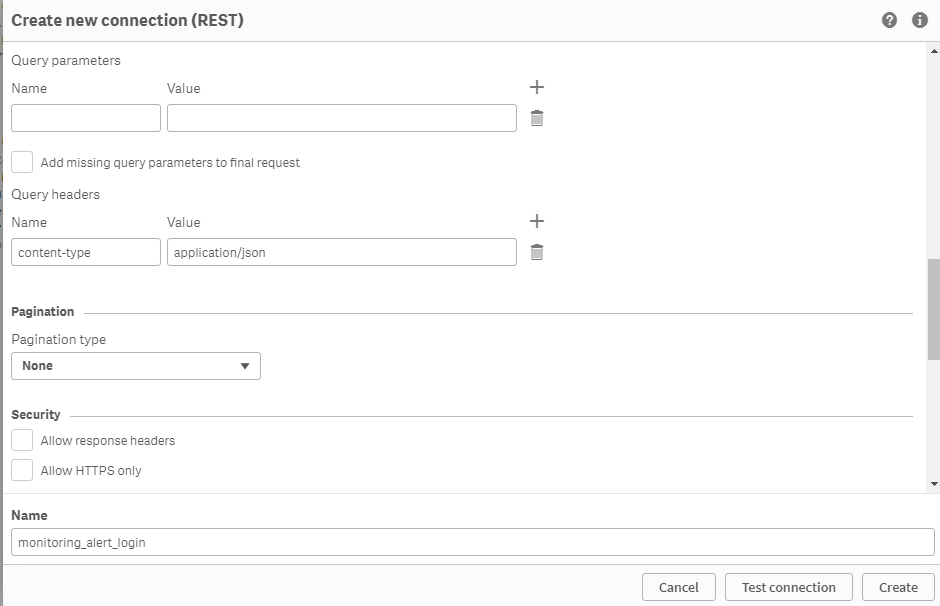
{"user":"<your_QA_username>","password":"<your_QA_password>"}In the query headers section enter
Name Value content-type application/json - Click on test connection and you should see a successful result message.
- Enter a name for this connection "monitor_alerting_login"
- Click on Create
- As a final step we want to make the name of this connection generic so any code parts below, and in the monitoring app, will work without changes.
- Navigate to QMC > Data Connections and find your new connection which will look like "monitor_alerting_login <domain_user>".
- Edit this record and remove the <domain_user> in the name field, along with any spaces that exist between the monitor_alerting_login and <domain_user>.
- Save the record
You are now setup to use this API to create a request to authenticate against Qlik Alerting. Follow the monitor_alerting setup below to see how this works.
Setup the monitor_alerting data connection
This request will be used to retrieve data from Qlik Alerting. We will be passing a different endpoint URL through this connection in the monitoring app script so we do not need to create a connection for each endpoint.
NOTE: this process is a little more complex as we will need the session token from running the monitor_alerting_login result to actually run this process. This is covered in the steps to help you through this.
- we will need to setup the monitor_alerting_login connection to retrieve the session token
- copy the script part below into a new tab in your script
edit the <QA_Server> and <QA_https_port> in the Let vURL variable
LIB CONNECT TO 'monitor_alerting_Login';

Let vURL = 'https://<QA_Server>:<QA_https_port>/api/login';

Connection:
LOAD [token],
[userId],
[userName],
[firstName],
[isAdmin],
[license],
[expiresOn]
;
SELECT
"token",
"userId",
"userName",
"firstName",
"isAdmin",
"license",
"expiresOn"
FROM JSON (wrap on) "root"
WITH CONNECTION(
Url "$(vURL)"
)
;

// Set new variable values
LET vAuth = Peek('token',0, 'Connection');
LET vUserId = Peek('userId',0,'Connection');
LET vUserName = Peek('userName',0,'Connection');
LET vAdmin = Peek('isAdmin',0,'Connection');

Trace >>>;
Trace >>> Auth $(vAuth);
Trace >>> User $(vUserId);
Trace >>>;

drop table Connection;
- Reload the application from the data load editor window but DO NOT close the script window yet.
- The script popup will show a number of trace items which present the variable outputs in the script text.
- Copy the Auth & User values and paste in a note as we will use this in the next step
- Create a new data connection using the REST data connection type
- Enter the URL updating your <QA_Server> and <QA_https_port> values
https://<QA_Server>:<QA_https_port>/api/groups/users
- Leave the Method option as GET
In the query headers section enter the following two
Name
Value
authorization
<auth value copied from step 3>
userid
<user value copied from step 3>
- Click on test connection and you should see a successful result message.
- Enter a name for this connection "monitor_alerting"
- Click on Create
- Enter the URL updating your <QA_Server> and <QA_https_port> values
- As a final step we want to make the name of this connection generic so any code parts below, and in the monitoring app, will work without changes.
- Navigate to QMC > Data Connections and find your new connection which will look like "monitor_alerting <domain_user>".
- Edit this record and remove the <domain_user> in the name field, along with any spaces that exist between the monitor_alerting and <domain_user>.
- Save the record
You have now setup the two data connections and should be able to import and reload the Qlik Alerting Monitoring.qvf application as per the instructions above.
You can also find a copy of the QVF that was released with the September 2020 version attached to this document.
- Move Comment
- Delete Comment
- Mark as Read
- Mark as New
- Bookmark
- Permalink
- Report Inappropriate Content
Hi ,
I follow your instructions for create manully monitor_alert_login Connection but I have this error:
"The underlying connection was closed: Could not establish trust relationship for the SSL/TLS secure channel."
Could you help me ?
- Move Comment
- Delete Comment
- Mark as Read
- Mark as New
- Bookmark
- Permalink
- Report Inappropriate Content
@steeramp First question i would have is whether you have the port correct as your screenshot says 4452 rather than 4552.
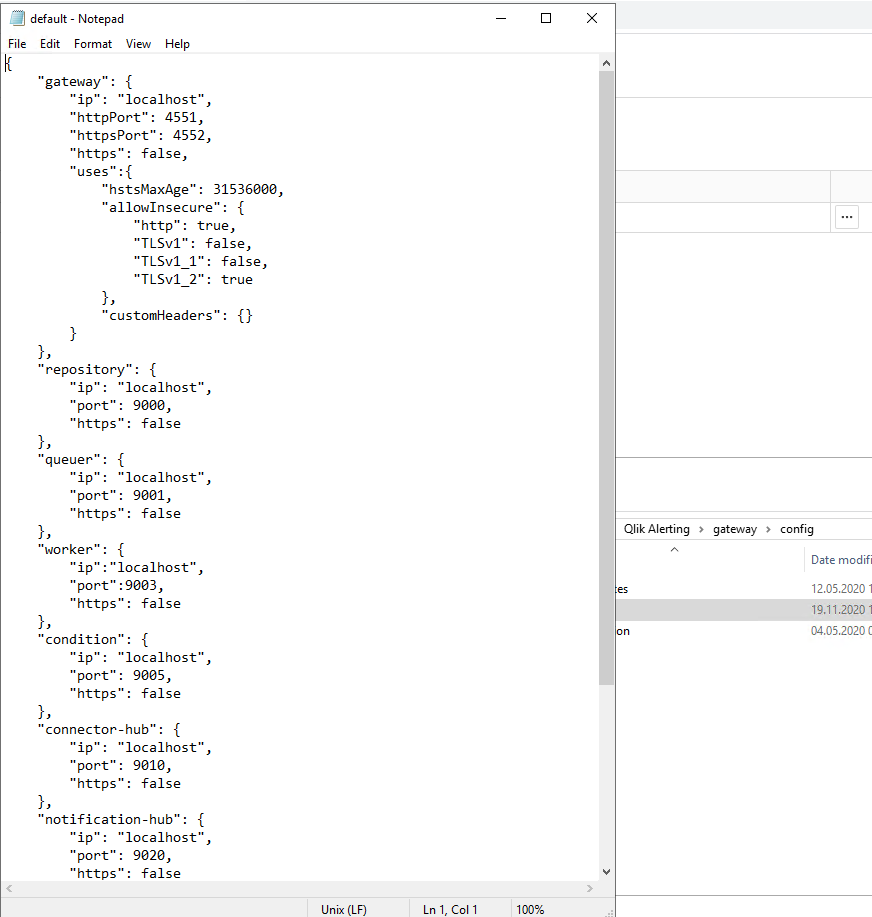
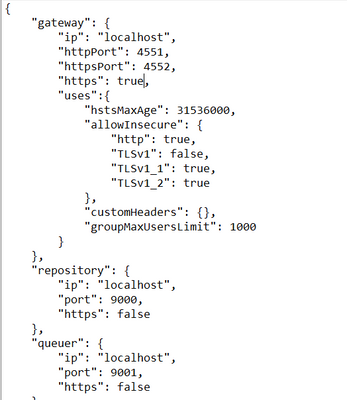
Secondly if you're getting an SSL error then there are some TLS settings in the C:/qlik alerting/gateway/config/default.json file... If you are using TLS 1.2 or 1.1. you will need to enable these as by default QA will use the latest (TLS 1.3).
Let me know if that helps.
- Move Comment
- Delete Comment
- Mark as Read
- Mark as New
- Bookmark
- Permalink
- Report Inappropriate Content
I follow you one screenshot about my Defaul.json file: what I need to modify in your opinion?
.. and about the port , I'm a little confused , of course is 4552
- Move Comment
- Delete Comment
- Mark as Read
- Mark as New
- Bookmark
- Permalink
- Report Inappropriate Content
@steeramp Re the port being different in the gateway config file. The key point to remember is that the value in the c:/program files/qlik alerting/config/default.json will override the value in the config files for the specific services. So your 4452 value in that file allows you to access with port 4452 rather than 4552.
I can replicate your error when Qlik Sense is using an SSL connection (i.e. trusted certs) but Qlik Alerting is not. I think this is likely your issue here and you could revert to http to test. See the help site link for info on how to add your SSL certs.
- Move Comment
- Delete Comment
- Mark as Read
- Mark as New
- Bookmark
- Permalink
- Report Inappropriate Content
Hi ,
I follow your instructions for create manully monitor_alert_login Connection but I have this error:
"The underlying connection was closed: Could not establish trust relationship for the SSL/TLS secure channel."
I checked also the default.json file in c:/program files/qlik alerting/config
I followed also the instruction about certificates, I copied the same certificates I created in qlik sense to connect qlik alerting
do you have any hint to solve this problem?
- Move Comment
- Delete Comment
- Mark as Read
- Mark as New
- Bookmark
- Permalink
- Report Inappropriate Content
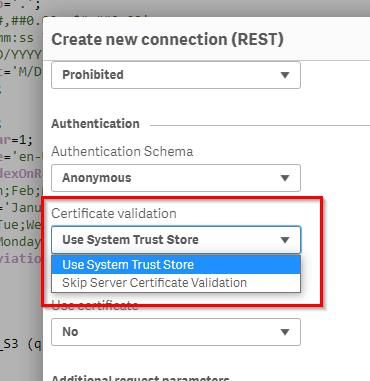
it is necessary to select in Certificaton Validation: Skip Server Certificate Validation
