Unlock a world of possibilities! Login now and discover the exclusive benefits awaiting you.
- Qlik Community
- :
- Support
- :
- Support
- :
- Knowledge
- :
- Member Articles
- :
- Create a Cycle Group in Qlik Sense (without extens...
- Edit Document
- Move Document
- Delete Document
- Subscribe to RSS Feed
- Mark as New
- Mark as Read
- Bookmark
- Subscribe
- Printer Friendly Page
- Report Inappropriate Content
Create a Cycle Group in Qlik Sense (without extensions)
- Move Document
- Delete Document and Replies
- Mark as New
- Bookmark
- Subscribe
- Mute
- Subscribe to RSS Feed
- Permalink
- Report Inappropriate Content
Create a Cycle Group in Qlik Sense (without extensions)
One of the features that I miss from QlikView when working with Qlik Sense is the Cycle Group. Allowing the user to pick a dimension and have that update in all charts where it was used is incredibly useful.
To get around this I use a data island listing dimensions and a filter box to pick which dimension is to be used. This application demonstrates the technique, over some data from Grand Slam Tennis Tournaments.
There is a full description of how to create the application from the ground up, in this blog post:
https://www.quickintelligence.co.uk/qlik-sense-cycle-group/
I hope that you find this document useful. You will find other applications that I have uploaded under my profile on Qlik Community, or listed on my website here.

Note that the document and blog post have a fixed dimension label, as this was all that was possible at the time of writing. The ability to have dynamic labels has since been added, and you can create a label on the Master Dimension with this code:
='$(=vDim)'
This will then show the field name as the column title and as the label on any charts where it is used.
Also, the addition of variable extensions in the Extensions Bundle means that you can use this to pick your field, rather than a filter pane - which looks a little neater. The filter pane does allow you to add extra fields in the load script (perhaps from a spreadsheet).
Steve
Update May 2022
The Wikipedia pages that this app loaded from were updated, so I have uploaded a revised app which now loads from the new layout. It also now contains stats from the Ladies game.
If you want a even more dynamic user interface, with users selecting both dimensions and measures, then please take a look at my tutorial post on the Instant Sense Application, here:
https://www.quickintelligence.co.uk/instant-qlik-sense-application/
You can try the application for yourself here:
https://www.quickintelligence.co.uk/sense/gs-app.html
Or download it from here:
https://www.quickintelligence.co.uk/instant-qlik-sense-app/
- Move Comment
- Delete Comment
- Mark as Read
- Mark as New
- Bookmark
- Permalink
- Report Inappropriate Content
Hi Steve,
thanks for the post.
I used a similar technique in QV because this is a failry easy to manage solution and it is more intuitive for the end user compared to the actual cyclic group.
On the other hand I found some strange behaviour in Qlik Sense. In particular QS seems to have some issues in managing squared parenthesis [] that wrap the field name: when using parenthesis in fact, the chart gets calculated correctly as expected, but QS has problems assigning colors. When the name of field is wrapped in squared parenthesis the only colour used in the chart is grey. Of course you don't need to wrap the field if its name has a single word, but I found no way to apply this technique for fields with spaces in their name.
Did you experience the same? Have you found a solution to this issue other than replacin spaces with other characters in field names?
Thanks
Ciao
Paolo
- Move Comment
- Delete Comment
- Mark as Read
- Mark as New
- Bookmark
- Permalink
- Report Inappropriate Content
Hi Paolo,
Thanks for your comment. I've seen a few cases where Sense renders bars in grey (usually when using Set Analysis in the expression) but I've not seen it in this scenario. In fact, I've just tried to cause the issue you describe and can not get it to occur. Which version of Sense are you using? Did it happen with the example file attched above?
If you set a colour expression, does it respect that expression or does that also go grey?
I'm curious to know what is going on there!
Cheers,
Steve
- Move Comment
- Delete Comment
- Mark as Read
- Mark as New
- Bookmark
- Permalink
- Report Inappropriate Content
Steve, I've seen this issue before too. The colors don't get rendered properly. I had it in Version 3 and 3.3.2
- Move Comment
- Delete Comment
- Mark as Read
- Mark as New
- Bookmark
- Permalink
- Report Inappropriate Content
Steve - Don't you think Alternative measures do the job just as good?
- Move Comment
- Delete Comment
- Mark as Read
- Mark as New
- Bookmark
- Permalink
- Report Inappropriate Content
Hi Vishnu,
I like alternative dimensions, but they can not be used in every circumstance, changing the dimension on a Scatter Plot or Table for example. This approach works in more scenarios. The other advantage, which a QlikView Cycle also had, is that when you change it on one chart it changes on every other chart also.
I had utilised this approach in Sense before Alternate Dimensions had been added (relatively recently), and may not have had the impetus to do so if Alternate Dimensions were there from the first release. I still think there is a place for this way of doing things.
Steve
- Move Comment
- Delete Comment
- Mark as Read
- Mark as New
- Bookmark
- Permalink
- Report Inappropriate Content
Hi Steve,
What you said is true.
I'm not entirely a fan of Alt. Dim/Meas. They work fine for simple metrics but there could be issues where the grain of the dimension needs to match the grain of the measure we're calculating on.
For e.g. the grain of the dimension in Aggr function, for best results, needs to match that of the dimension in the chart object.
/* This is tangential to the discussion but I wanted to bring this thought. */
I like the logic you used here.
- Move Comment
- Delete Comment
- Mark as Read
- Mark as New
- Bookmark
- Permalink
- Report Inappropriate Content
It's a bit of an issue with everything in Sense, where you have master dimensions and measures which you let users loose with - but some measures only work when paired with certain dimensions (when AGGR is used being a case in point). It means a data dictionary and documentation needs to be provided to users for some apps, making sure they only use combinations that work correctly.
The implementation here of selecting a dimension (or multiple dimensions) from a Filter Pane list assists with this, as you can put the selected field into both the dimension and also inject it in the measure if required for an AGGR or similar.
Steve
- Move Comment
- Delete Comment
- Mark as Read
- Mark as New
- Bookmark
- Permalink
- Report Inappropriate Content
Good point Steve. I've made a recommendation to give the option of "linked metrics" in Alternate dimensions - where in the measures can only be viewed with a pre-defined dimension. This is IN ADDITION to Alternate Measures/Dimensions.
- Move Comment
- Delete Comment
- Mark as Read
- Mark as New
- Bookmark
- Permalink
- Report Inappropriate Content
Hi Steve,
at the moment I am using the latest release (Sep 2017) and I have experienced the same problem wiht the previous (Jun 2017).
I have investigated a bit more: everything works fine when you deal with a chart having a single dimension. When you add a second dimension (for example to display a trend), if the expression contained in the dimension is wrapped in [], the grey issue appears, so it appears for every field with more than 1 word in its name.
The weirdest thing is that if you drag a new chart on the existing one (the one with grey issue) and you convert the problematic chart to a new chart type following the wizard, the issue disappears.
I have attached 2 images with 2 charts.
The first chart has been created manually and it has issues with [] wrapped fields.
The second has been copied and pasted starting from the first, converted to a bar chart and then converted again to a line chart. It has no issue.
Below one image where the selected Dim is Address (1 word with no []). Both charts are ok.

Now if we select [Crime Category] (2 words wrapped in []) in the cyclic dimension field, the first chart is all grey while the second has no issues, but in theory they are the same.
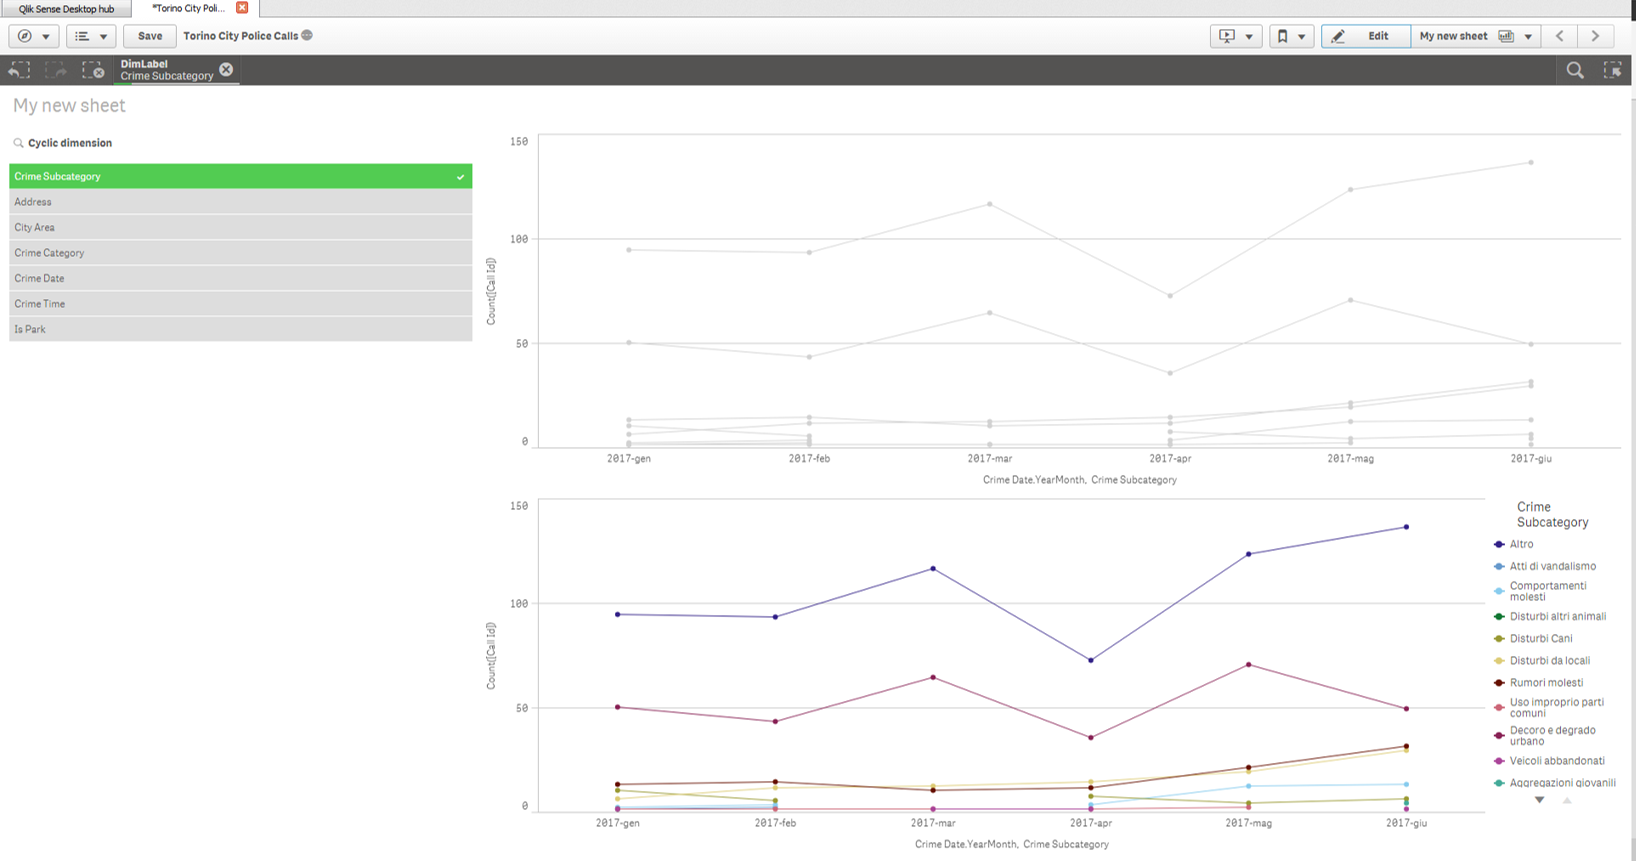
The good thing is that I can use this technique. The bad thing is I do not know how predictable the results could be.
Please let me know if you have experienced different behaviours.
Paolo
- Move Comment
- Delete Comment
- Mark as Read
- Mark as New
- Bookmark
- Permalink
- Report Inappropriate Content
Hi Paolo,
That is not something I have encountered, but it doesn't entirely surprise me.
Thanks for documenting here, and advising the fix.
Steve