Unlock a world of possibilities! Login now and discover the exclusive benefits awaiting you.
- Qlik Community
- :
- Forums
- :
- Forums by Product
- :
- Products (A-Z)
- :
- Qlik Sense
- :
- Documents
- :
- Web integration: embed Sense charts or data inside...
- Edit Document
- Move Document
- Delete Document
- Subscribe to RSS Feed
- Mark as New
- Mark as Read
- Bookmark
- Subscribe
- Printer Friendly Page
- Report Inappropriate Content
Web integration: embed Sense charts or data inside your own website
- Move Document
- Delete Document and Replies
- Mark as New
- Bookmark
- Subscribe
- Mute
- Subscribe to RSS Feed
- Permalink
- Report Inappropriate Content
Web integration: embed Sense charts or data inside your own website
also see integration.qlik.com/slides
<widgets will be added later on>
Table of Contents
- Introduction
- IFrame: Easy integration of App, sheet or charts
- Create mashups (1 HTML page which contains both OEM partner content and Sense content)
- Creating mashups with the Mashup editor (DIV tag integration)
- Creating mashups with the Visualization API
- Qlik Visuals
- Qlik Analytics for Visual Studio plug-in
- Mashup Examples
- Extensions: the ability to create your own visualizations (charts, custom JS objects) inside an app
- Use Sense as a fast in memory database: Show Sense data/raw JSON objects in your own webserver
- Appendix A: Summary of the javascript div tag integration approach
Introduction
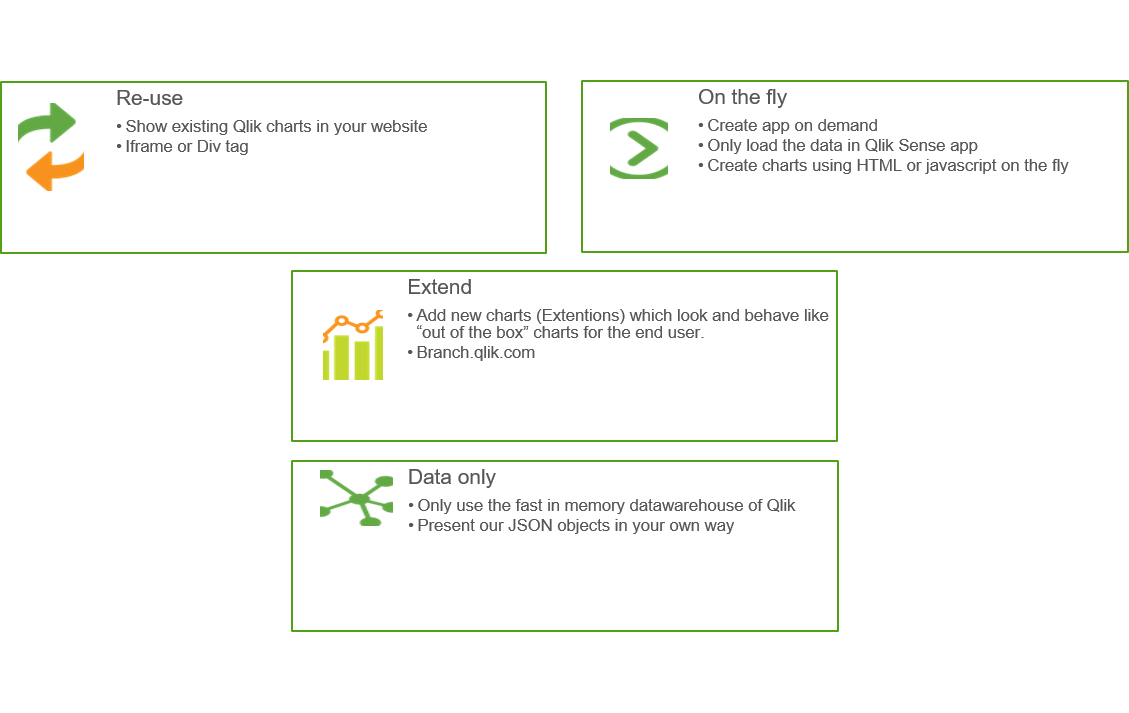
There are 5 ways to integrate Qlik Sense into your website, our development hub or the Visual Studio plugin helps you will even generate the code for you! So most of the time you have to select or drag and drop to create an integrated web page. |
|
Approach | Complexity | Template | Result |
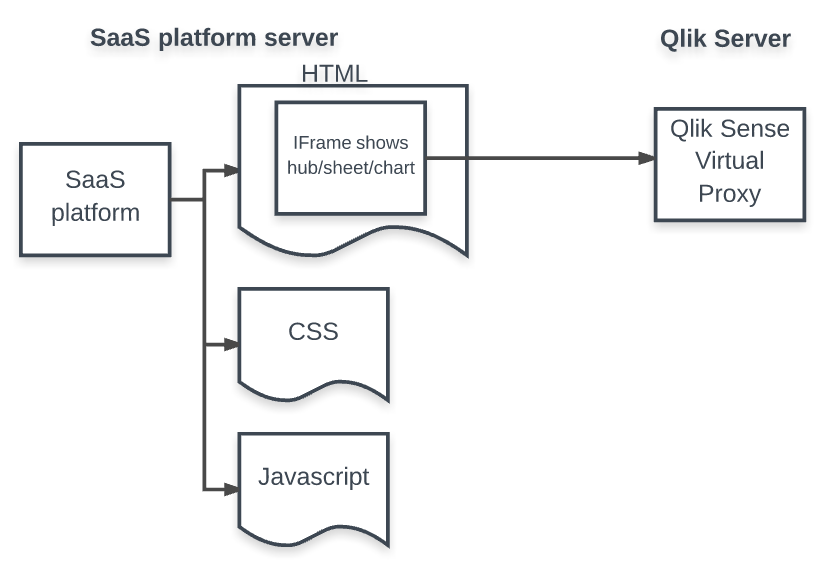
Iframe via app integration API and single configurator - paste Sense URL in Iframe on your site. | Very Simple, but ensure you know how to authenticate the user. |
| A Complete Sense hub, or dashboard or sheet or individual object. The App Integration API provides parameters that can be used to create an URL that returns a complete HTML page containing the embedded app. This URL can be embedded in a web page, for example by including it in an iframe. It allows you to pass parameters to an app and to open an app with one or several selections applied. |
Mashup editor - DIV tags and javascript | Javascript knowledge needed | 1 complete integrated webpage using a div for each chart or sheet. You can pass context via REST or javascript API's | |
Visual web component - only HTML tags | HTML knowledge needed | 1 html page (of the OEM partner), which includes sense charts by using simple HTML tags: <qlik-visual appid="Helpdesk Management.qvf" type="barchart" cols='["Case Owner Group","=Avg([Case Duration Time])"]' options='{"title" : "On the fly barchart"}' > </qlik-visual> | |
Javascript knowledge needed | This example creates a bar chart with one dimension, one measure and definitions for title, subtitle and footnote. app.visualization.create( 'barchart', | ||
Javascript knowledge needed | New visualizations objects inside a QVF file which respond to selections and the Qlik Sense Engine like out of the box vizualizations do. |
Using these options you can
- Show a complete dashboard or individual charts in your website,
- Create new charts on the fly, based on data from our engine. (you no longer have to create something upfront, only the datamodel)
- You can create your own web client, and introduce your own "flow" and functionality as can be seen in the the "pin it dashboard" demo.
- Authorization: The charts will only show the data where the user is authorized for automatically. (because your site forwards the identity of the user and its group membership to Sense)
Web integration mindmap
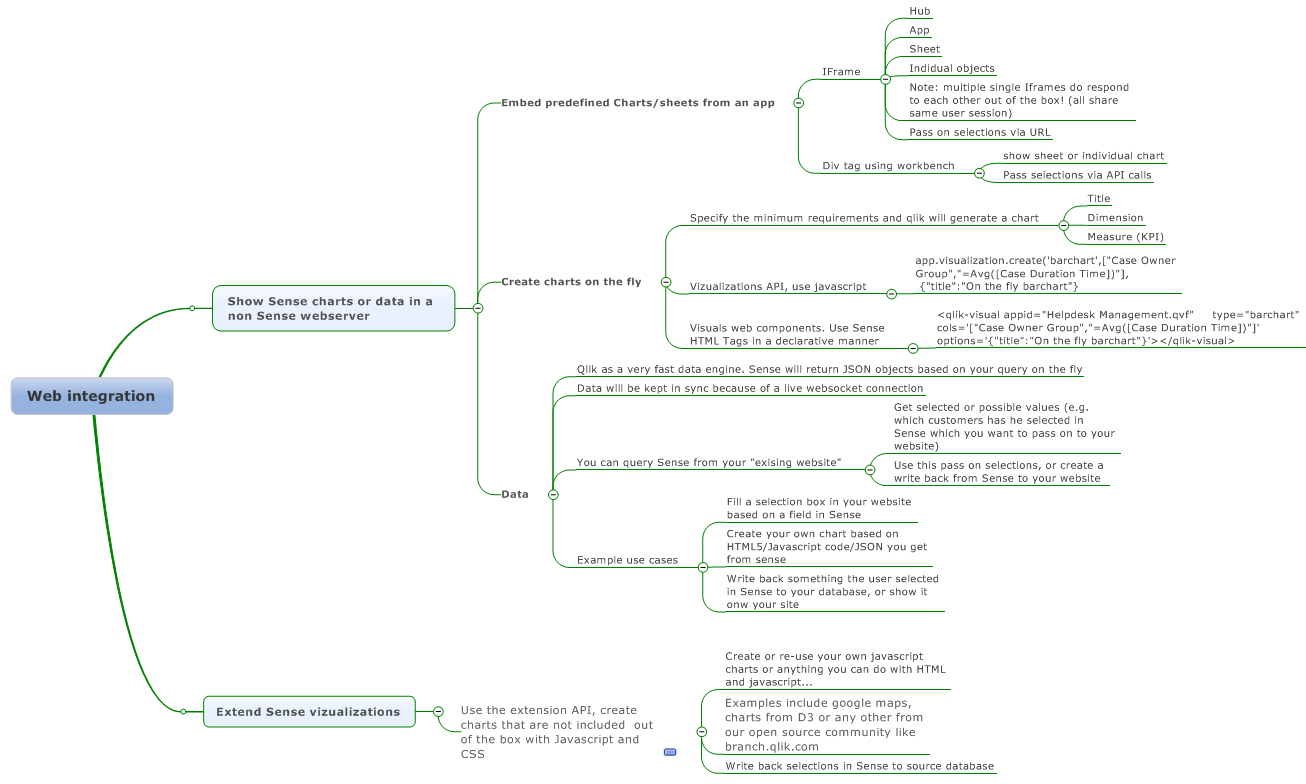
IFrame: Easy integration of App, sheet or charts
You can use the Single Integration API for iFrame integration. Use the Single configurator tool to get started. Go to http://localhost:4848/dev-hub/single-configurator (ensure Sense Desktop is running when you test this)
Extra Documentation
Note that
- You can also use multiple single object iframes on your site. Which all respond to each other for example when you make or clear a selection.
- You can easily pass a selection by appending this in the url: https:\\ host.com\qlik\?selection:region=France
- Iframes are very simple to use and are therefore the preferred option to integrate web content.
- Very easy to use and get your product live. You don't get challenges with cross site scripting, CSS or javascript integration.
Create mashups (1 HTML page which contains both OEM partner content and Sense content)
There are 3 ways to show Sense content integrated into your website's HTML
- Embed charts you have already created using the mashup editor or the Visual Studio Plug-in
- Create charts on the fly using
- Visualization API using javascript
- Qlik Visuals using HTML tags
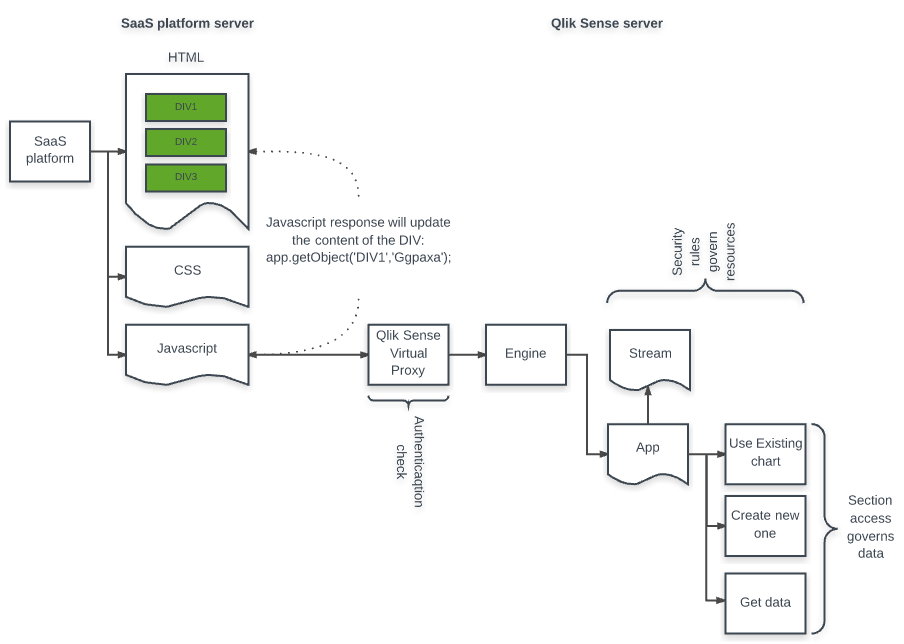
Creating mashups with the Mashup editor (DIV tag integration)
You can reuse Qlik Sense visualizations, including your custom extensions, and you can also make use of Qlik Sense data and calculations.
By using active content, your visualizations are updated when state, like selections, in your app changes. You can also subscribe to data and change the state through the visualizations.
In short it works like the following:
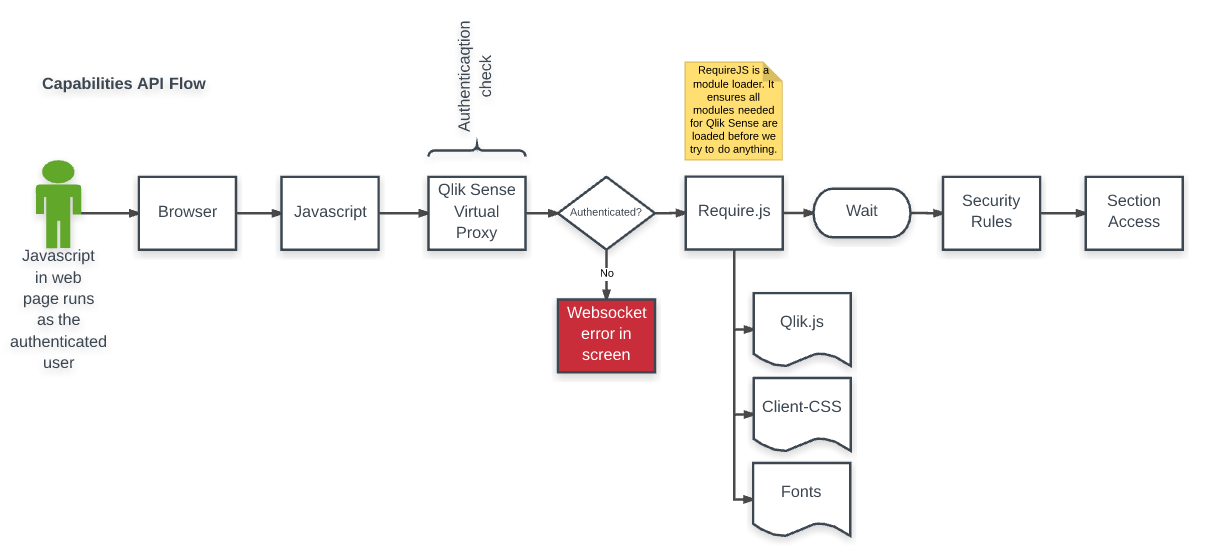
- You open a web socket to Qlik Sense Engine using the qlik.openApp method.
- Objects use the same web socket, that is the same session, which means they are connected.
- Qlik Sense objects work just as they do in the Qlik Sense client.
You can also use one or more charts, sheets, dashboard or our hub (app overview) in your own website. See a quick intro video to our workbench here , on the help, or watch this video to see how you can interact with Sense by creating your own HTML pages. Because everything is HTML5 and JavaScript you can also create your own data entry forms and retrieve sense data, make some comments, and write it back into the database. (Action based reporting: See something, analyze and store the result/action). Or use our data to fill your html objects (dropdown filters etc); all fully reactive.
The advantage of using the DIV tag approach is that you create 1 integrated site which is presented to the end user. (No Iframe)
Example source project on our open source community which shows a mashup.
Creating mashups with the Visualization API
Prio to Qlik Sense 2.2 a developer had to create visualization objects first in Qlik Sense to embed those into mashup based websites. By using the newly introduced JavaScript API Visualization API it is now possible to create all objects on the fly. You just need a Qlik Sense app (containing the data model and data) and then you are ready to go. See JSFiddle example code.
Bar chart on the fly
Based on the Visualization API Qlik Visuals allows you to create visualization objects on the fly in a 100% declarative manner:
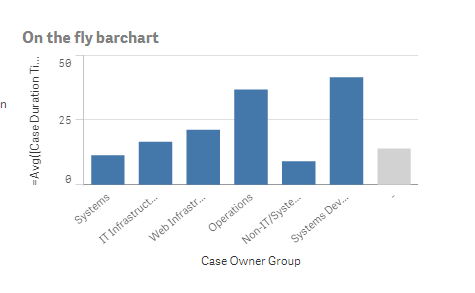
<qlik-visual appid="Helpdesk Management.qvf"
type="barchart"
cols='["Case Owner Group","=Avg([Case Duration Time])"]'
options='{"title":"On the fly barchart"}'>
</qlik-visual>
Results into:
Pivot-table on the fly
This example creates a pivot table with two dimensions and two measures and label definitions for the measures.
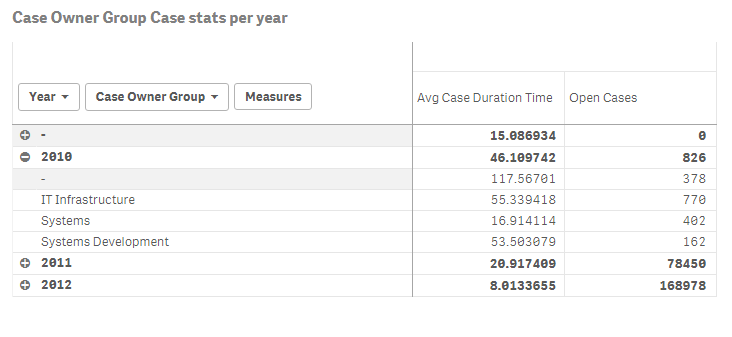
<qlik-visual appid="Helpdesk Management.qvf"
type="pivot-table"
options='{"title" : "Case Owner Group Case stats per year"}'
cols='[
"Year", "Case Owner Group",
{
"qDef" : {
"qDef" : "=Avg([Case Duration Time])",
"qLabel" : "Avg Case Duration Time"
}
},
{
"qDef" : {
"qDef" : "Sum( [Open Cases] )",
"qLabel" : "Open Cases" }
}
]' >
</qlik-visual>
Example code output:
Qlik Analytics for Visual Studio plug-in
You can also use this visual studio 2015 plug-in to embed Sense in your website and is available on the Microsoft's plugin site. This allows you to drag and drop Qlik Sense content and the code will be generated for you. The Visual Studio plugin is a development toolbox created to simplify the process of integrating Qlik Sense functionality into other environments. Qlik Analytics for Visual Studio provides quick access to relevant information from your Qlik Sense environment, which for instance makes it easy to integrate Qlik Sense visualizations into an existing web site.
You will be able to:
- See all your apps, with related sheets and objects.
- See a preview of the object.
- See the properties of the server and charts.
- Drag-and-drop objects (in different modes) directly into your code.
See appendix A for more info.
Mashup Examples
A great example of what the workbench or Qlik Analytics Platform can do is showcased through our partnership with NCAA.com, where the platform was used by our own web developers to build custom embedded analytics in the NCAA.com website providing insight into the performance of teams in the Men’s College World Series baseball championship.
Examples |
AFAS jaarverslag |
Get started to work with mashups
- Examples to get started with mashups.
- Sense mashup deployment manual
- Real integration examples on JSFiddle
- This example shows you how to connect to Sense data and vizualize it using D3.
- creating-a-website-with-angular-and-the-capabilities-api
- Example nodejs ticket and div integration
- Sense Utils: Handy package to include Sense in your site (see examples from Axis group)
Extensions: the ability to create your own visualizations (charts, custom JS objects) inside an app
See this 60 second video to start.
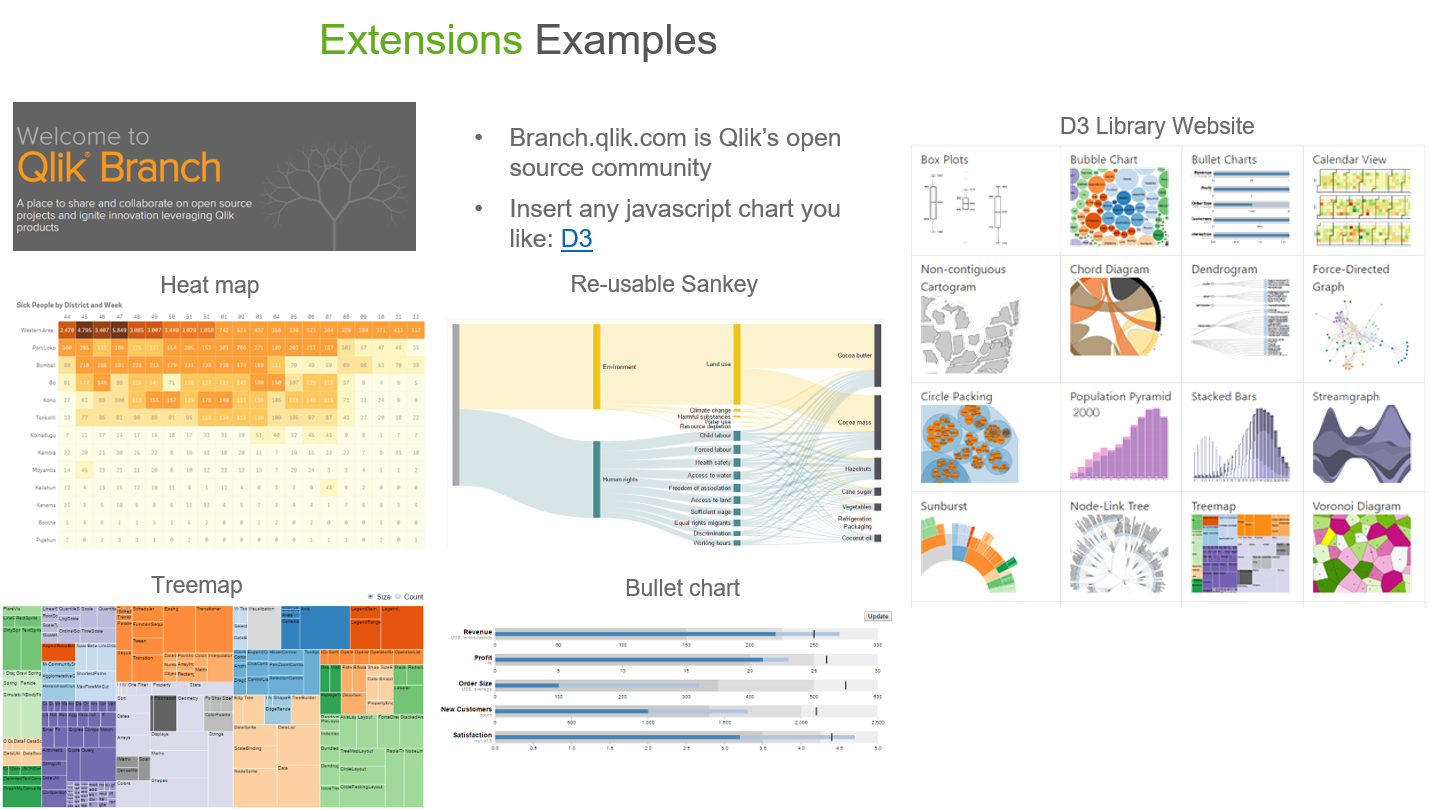
Extensions are used to extend the out of the box charts in Qlik Sense based on open standards such as HTML5, JavaScript and CSS. The new objects behave the same as "out of the box charts" with full two way interaction with Qlik datamodel and selections made. They create new ways to visualize data and enhance user input and interaction. They can integrate with other systems (such as write back selected items to source database) and visual libraries such as D3, google maps, youtube and other webservices, or you can add new selection objects (sliders, input boxes).
Qlik Sense’s JavaScript APIs bring the power of Qlik Sense to web application development. It enables JavaScript developers to build data analysis and visualization applications using Qlik Sense charts. The developer can insert pre-built charts into their web page make it very fast to build applications, unlike D3 where the user has to build each visualization from scratch. Because Qlik Sense charts are linked, selections one chart automatically propagate through all charts. Qlik Sense charts and data can also be used in mashups, for example, an RSS feed address could come from a field in a Qlik Sense table – to support the building of mashups, Qlik Sense has a built-in mashup editor. Qlik Sense data can be used in D3 or in other JavaScript-based visualization libraries.
All of the technology will be very familiar to web developers – it’s based on JavaScript, HTML, and CSS3. For those developers interested in the deep technical javascript instructions:
The posts reference some code samples on Qlik Branch (our open source community to extend functionality of Sense using our API's) here. Read the tutorial for more information.
What | Where |
Get extensions and collaborate with other developers | |
Extension tutorial from R&D (S. Walther), also check his projects | |
Key Qlik developer to follow: A. Karlsson | |
Need help? Please join our Slack channel | Slack |
Deep dive javascript video tutorials, showing you how to connect to Sense and get JSON data in your app, execute selections, and automate everything | Youtube Part 1: Getting Set Up Part 2: Embedding Objects Part 3: Connecting to Fields Part 4: Creating HyperCubes |
Create your own color themes |
Use Sense as a fast in memory database: Show Sense data/raw JSON objects in your own webserver
You can also just use the data from Qlik Sense do with it whatever you want;
- Fill list boxes or sliders
- Include Sense charts which automatically respond to selections made.
- Video explaining connecting to and selecting in fields inside an non Qlik Sense website.
and make sure the whitelist is populated
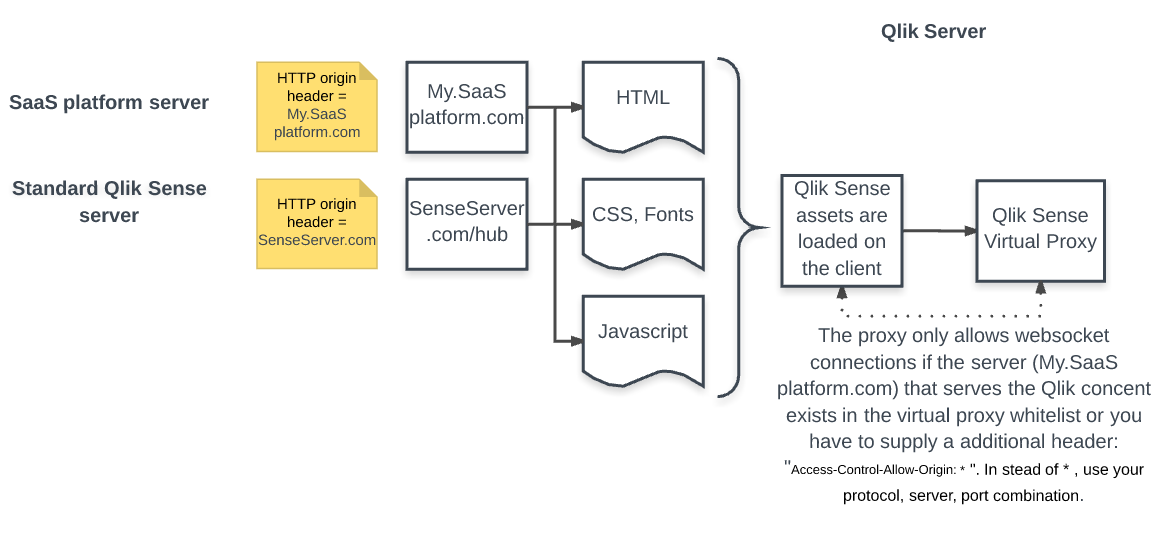
Appendix A: DIV tag integration approach on external server
- You create a normal HTML page which you can create with "drag and drop" in our dev-hub. Using this approach you can link the DIV to a Sense chart ID.
- You can better link to the Sense server or you copy our requireJS, CSS and fonts to your webserver.
RequireJS | C:\Program Files\Qlik\Sense\Client\assets\external\requirejs <script src="../../resources/assets/external/requirejs/require.js"></script> |
CSS | C:\Program Files\Qlik\Sense\Client\autogenerated Include <link rel="stylesheet" href="../../resources/autogenerated/qlik-styles.css"> |
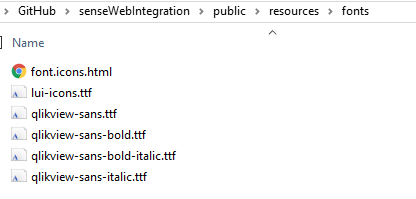
Fonts | Go to C:\Program Files\Qlik\Sense\Client\fonts on your Sense server. In your external webserver create a resources/fonts directory (in your web server root) and copy the fonts |
You include a reference to these local files (to prevent cross site scripting); The require.js, the css and the fonts from above. | E.g. I have put them in the server\public folder on my external web server.
|
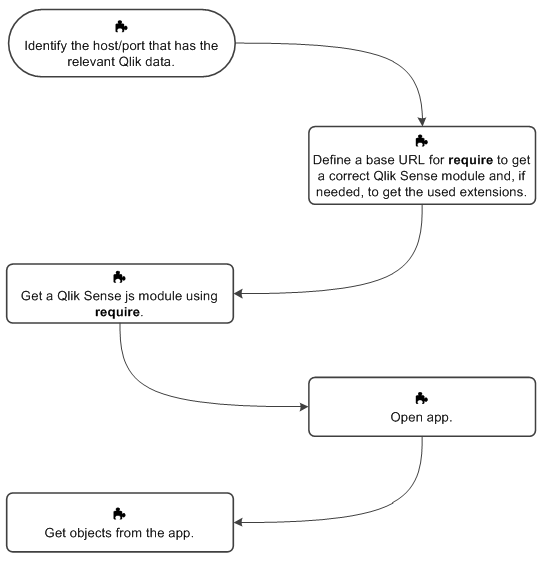
- You create a Javascript file
- This file contains a config object, which points to your Sense Server. This file is basically the "bridge" between your website and Sense
- In this javascript file you attach a DIV id to a Sense Chart ID (is being generated for you if you drag and drop), and you are done.
var config = {
host: "myhost.com",
prefix: "/",
port: window.location.port,
isSecure: true
};
require(["js/qlik"], function(qlik) {
// open the app
var app = qlik.openApp("c31e2aba-3b46-4b13-8b87-c5c2514dea1d", config);
// insert Qlik objects into the page.
app.getObject(document.getElementById("LB01"), "uPyZavD");
From: https://help.qlik.com/en-US/sense-developer/2.2/Subsystems/Mashups/Content/mashups-introduction.htm
PS: note that if you create a new project in the dev-hub, it will generate a starting template for you with the HTML, CSS and the javascript file. This tool will also generate the object guids (id) for you.
- Move Comment
- Delete Comment
- Mark as Read
- Mark as New
- Bookmark
- Permalink
- Report Inappropriate Content
Hi Martijn,
Thanks for this comprehensive information! I wonder if you can help me given all of the above.
I am currently trying to embed a sample dashboard from Qlik Sense Desktop onto my WIX website.
WIX only allow secure links starting with HTTPS and when I use the single configurator in the dev hub of Qliksense desktop I end up with an HTTP link (e.g <iframe src='http://localhost:4848/single/?appid=D%3A%5CDocuments%5CQlik%5CSense%5CApps%5CHelpdesk%20Management.q...' style='border:none;'></iframe>).
Do you know how I can convert the above link to HTTPS / create a new HTTPS link to embed a whole dashboard (I know Qlik Sense Cloud's Charts option allows to embed single charts but I need the full dashboard to be embedded).
Thanks in advance!
- Move Comment
- Delete Comment
- Mark as Read
- Mark as New
- Bookmark
- Permalink
- Report Inappropriate Content
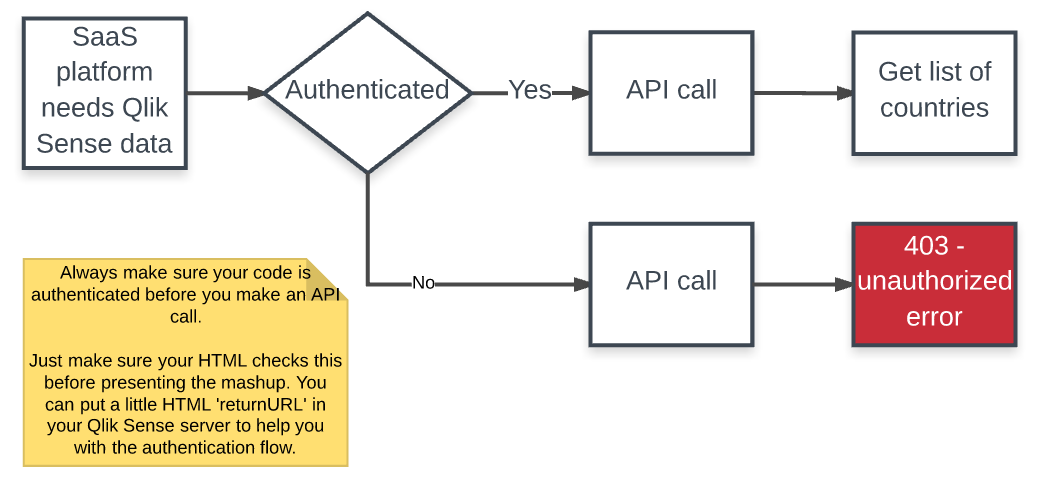
Hi, Yes that should be possible. If this does not work its best to join our branch slack channel and ask your questions over there. See the link on SaaS with Sense API tab.
- Move Comment
- Delete Comment
- Mark as Read
- Mark as New
- Bookmark
- Permalink
- Report Inappropriate Content
just replace the http with https on the server and you need an app guid and not the name of the app. (I don't know if you can test https with the desktop, I suspect not)
- Move Comment
- Delete Comment
- Mark as Read
- Mark as New
- Bookmark
- Permalink
- Report Inappropriate Content
Hi,
I had integrated Qlik Sense Charts with website. I had generated Iframe URL by using single-configurator (dev-hub) and pasted the url in website.
When our remote users open the web page then they are not able to see any chart.
Our remote users don't have any Qlik Sense Licens.
In a same way, I have to login in Qlik Sense first and after that I open the Web page then I can see the chart otherwise I have the same issue as our remote users are facing.
Please suggest me, how I can publish and provide the dashboard access to remote users via web page.
- Move Comment
- Delete Comment
- Mark as Read
- Mark as New
- Bookmark
- Permalink
- Report Inappropriate Content
Sounds like you are trying to integrate charts with a public website?
Users need license and if you are on a public website with anonymous users you need special license for that.
Speak to your contact at Qlik about licenses for your use case (might be expensive).
An alternative would be to export static images from Sense and just publish those images.
- Move Comment
- Delete Comment
- Mark as Read
- Mark as New
- Bookmark
- Permalink
- Report Inappropriate Content
Hi,
We have Qlik Sense Enterprise Edition. Sharing image is not an option, if there is anyother alternative to publish chart on our own domain and hosting ? or other website?
Is there anyway to pass credentials for charts to open on website?
Please let me know the license type so that I can get an idea.
Example Video: https://youtu.be/FHQRaYOogiU
In this video, integration steps are availalble but how to provide access to the users not mentioned. I would like to do the same task but stuck as mentioned above.
- Move Comment
- Delete Comment
- Mark as Read
- Mark as New
- Bookmark
- Permalink
- Report Inappropriate Content
How to export static images from Sense and just publish those images on a public webpage. My web developer tried to copy the iframe from QS and pasted in Wordpress. But it doesn/t work. Any suggestions. I am using QS business cloud.