Unlock a world of possibilities! Login now and discover the exclusive benefits awaiting you.
Qlik Sense documentation and resources.
Recent Documents
-
Qlik Sense App - The QI Instanst Sense Application
This application is a tool that we use to create Proof of Concepts very quickly. The idea is simple. You upload the data you want to visualise and a s... Show MoreThis application is a tool that we use to create Proof of Concepts very quickly. The idea is simple. You upload the data you want to visualise and a spreadsheet of meta-data which defines dimensions and measures. The application template then takes care of the rest.
This video shows this in action:
If you would like to download this application and use it with your own data you can download it from here:
https://www.quickintelligence.co.uk/isa
I hope you find the application useful and as much of a time saver as we do.
A tutorial blog post giving some pointers as to how to build the components in this app, using only standard Sense features, can be found here:
https://www.quickintelligence.co.uk/instant-qlik-sense-application/
I hope that you find the application useful. You will find other applications that I have uploaded under my profile on QlikCommunity or on our Downloads page..
Steve

-
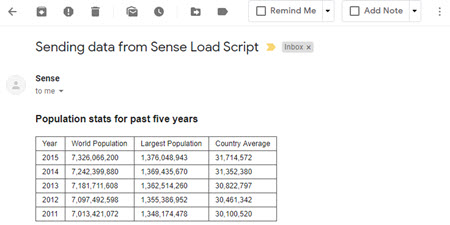
Qlik Sense App: Send Data From The Load Script
QlikView has two features which allow it to send alerts and data to the user, using Alerts in the front end or QMC notifications on the Server. Presen... Show MoreQlikView has two features which allow it to send alerts and data to the user, using Alerts in the front end or QMC notifications on the Server. Presently Sense lacks these out of the box, but it is possible to implement the same using the free Qlik Web Connectors SMTP Connector.
This application implements the sending of data as an HTML table embedded in an email each time an app is reloaded.
It was produced to go alongside this blog post, which describes the process in detail:
https://www.quickintelligence.co.uk/send-data-from-qlik-load-script/
I hope that you find the application useful. You will find other applications that I have uploaded under my profile on QlikCommunity or on our Downloads page..
Steve
-
Qlik Sense App: Prior Period Comparison with Set Analysis
This document shows how Set Analysis can be used to create a prior period comparison that is responsive to your current selections. The expressions ca... Show MoreThis document shows how Set Analysis can be used to create a prior period comparison that is responsive to your current selections.
The expressions can be applied to any data set where you have your main date field broken out into Day, Month and Year fields.
This application is a Qlik Sense version of the QlikView app that has been uploaded to Community here:
QlikView App: Set Analysis - Prior Period Comparison
There is further discussion on the app and technique in the comments there (including some important notes about when your data set doesn't have values for all dates).
There are a number of other tutorials and downloadable examples on our website here:
https://www.quickintelligence.co.uk/qlikview-examples/
If you have any questions please post them in the comments below.
Steve Dark
-
How to Create the Magic Quadrant Chart
How to Create the Magic QuadrantA magic quadrant chart is possible with the use of the basic map chart and various layers. This will use the basic map... Show MoreHow to Create the Magic Quadrant
A magic quadrant chart is possible with the use of the basic map chart and various layers. This will use the basic map chart in the included charts. This will also use point layers for the symbols and area layers for the grid. It has endless capabilities for use!
- Add the map chart.
- In Map Settings set the Base map to NONE.
- Set Projection to User Defined Degrees.
- Turn Off Legend in Legend Setting.
- Turn off Scale Bar in Presentation Settings.
- Add area layers for box.
- Add a layer titled box.
- Dimension equals 1.
- Location equals: ='[[[0,0],[100,0],[100,100],[0,100]]]'
- Add area layers for Grid.
- If using a 4 quadrant plane use the following:
- Add a layer titled Grid.
- Dimension equals 1.
- Location equals: ='['& '[[0,0],[50,0],[50,50],[0,50]],' & '[[50,50],[100,50],[100,100],[50,100]]' & ']'
- If using a 16 quadrant plane use the following:
- You need to add 4 grid layers.
- Each dimension is equal to 1.
- Locations are as follows:
- If using a 4 quadrant plane use the following:
Grid1: ='['&'[[0,0],[25,0],[25,25],[0,25]],' &'[[25,25],[50,25],[50,50],[25,50]]'& ']'
Grid2: ='['&'[[50,0],[50,25],[75,25],[75,0]],' &'[[75,25],[100,25],[100,50],[75,50]]'& ']'
Grid3: ='['&'[[0,50],[25,50],[25,75],[0,75]],' &'[[25,75],[25,100],[50,100],[50,75]]'& ']'
Grid4: ='['&'[[50,50],[75,50],[75,75],[50,75]],'&'[[75,75],[100,75],[100,100],[75,100]]'& ']'
- Set Grid and Box Colors to desired colors.
- For your dots or bubbles on the grid, add a point layer
- Use a unique dimension for the point layer.
- If you need separate type shapes, limit your dimension and set shape in settings.
- As location you need to have two separate fields with values that range from 0-100
- Set the “Y” value as the Latitude.
- Set the “X” value as the Longitude.
- If desired color by a particular method.
- Use a unique dimension for the point layer.
Quadrant Labels
For Labels you will need to add another point layer.
- Add point layer.
- Dimension is Label.
- Location is as follows:
- LabelY as Latitude.
- LabelX as Longitude.
- Make bubble size 0 and opacity far left.
- Under general options set show labels to ON and Centered.
- Inline load with coordinates is as follows:
4 Quadrant
QuadrantLabels:
load * Inline [
Label, LabelX, LabelY
UpperRight, 75, 98
UpperLeft, 25, 98
LowerRight, 75, 2
LowerLeft, 25, 2
];
16 Quadrant
load * Inline [
Label, LabelX, LabelY
X4, 87.5, 2
X3, 62.5, 2
X2, 37.5, 2
X1, 12.5, 2
Y1, 2,12.5
Y2, 2,37.5
Y3, 2,62.5
Y4, 2,87.5
];
Finished Product
- Add the map chart.
-
Data Model Simulator : Tool to explore different data model types and modelling ...
Data Model Simulator v1.1A tool developed for the purpose of testing different data modelling scenarios in Qlik Sense or QlikViewThe tool comprises of... Show MoreData Model Simulator v1.1
A tool developed for the purpose of testing different data modelling scenarios in Qlik Sense or QlikView
The tool comprises of:
* A Qlik Sense and a QlikView app that respectively allow for both simulation data generation as well as scenario testing of the generated data.
The code is commented with instructions on how to generate the data and subsequently how to run the different model scenarios.
* An optional PowerPoint slide pack for those of you who have heard me present the material and wish to have a reminder at hand of the topics and learning points covered.
The types of data models currently simulated by the app are:
1. A Multi-Fact model with a Link-Table / Bridge Table representing the associations between the facts
2. A Multi-Fact where the facts have been appended into a single mixed fact. Sometimes referred to as a "concatenated" or Mixed-Fact model
3. An Attribution model : Typically used for modelling Budget/Forecast data storing ratio attributions in a separate table with a many-to-many relationship with the Budget/Forecast fact.
4. A Multi-State or Life-Cycle model : A model where different states of a fact is represented, e.g. FX trade data confirmation flows (captured trade -> split trade -> adjusted trade ...)
To do list for future versions:
* Key-Value pair structured fact versus horizontally aligned (cross-table) structured fact
Any and all feedback including ideas for improvements is most welcome.
Enjoy!
Ps. If you are interested in getting a talk on Qlik data modelling arranged for your team / organisation, drop me an email or a note on LinkedIn. I'm a regular speaker at Qlik events and meetups and I enjoy networking, knowledge sharing and exchanging ideas. Ds.

-
A GeoAnalytics [extensive] Enablement
Through time, I have been delivering a few GeoAnalytics enablement sessions. Some with more in depth exercises than others. I've compiled a PDF with ... Show More
-
Qlik Sense App: Parse Router Logs in Qlik Sense Cloud
This app was created to accompany a tutorial blog post which shows how you can pick up content from emails, using the IMAP connector, and parse this i... Show MoreThis app was created to accompany a tutorial blog post which shows how you can pick up content from emails, using the IMAP connector, and parse this into an app. It was also created as I had a requirement to get information out of the logs on my Netgear R7000P router.
The solution is fully automated, with the router sending logs to an email account on a schedule and Sense then picking those logs up each day.
Here is the link to the blog post with all the instructions on building this solution from scratch:
https://www.quickintelligence.co.uk/netgear-router-logs-qlik-sense/
The app takes unstructured log data and splits it into a table with multiple columns, making selections easier, and a sheet to visualise what is happening on your network - helping you stay secure.
Note that the app does not have any data or connections embedded in it. You will need to follow the instructions in the blog post to get the connection working and to be able to load data.
This is just one of the tutorial apps we have uploaded, you can find others here:
https://www.quickintelligence.co.uk/examples/
If you have any suggestions or comments please use the comments section, either here or on the blog itself. I would be particularly interested in knowing any other router models that this works with.
Many thanks,
Steve


