Unlock a world of possibilities! Login now and discover the exclusive benefits awaiting you.
- Qlik Community
- :
- All Forums
- :
- Integration, Extension & APIs
- :
- [QlikSense & Mashup] Implementing Hypercubes with ...
- Subscribe to RSS Feed
- Mark Topic as New
- Mark Topic as Read
- Float this Topic for Current User
- Bookmark
- Subscribe
- Mute
- Printer Friendly Page
- Mark as New
- Bookmark
- Subscribe
- Mute
- Subscribe to RSS Feed
- Permalink
- Report Inappropriate Content
[QlikSense & Mashup] Implementing Hypercubes with Two-level Dimensions
Hello,
I've been struggling with this subject for a while.
I have two Dimensions like "Country" and "City" (city belongs to Country) with two measures "Sum(Null_Votes)" and "Sum(TotalVotes)" and I want to present the data in a mashup with a pivot table and fully expanded with partial and total sums.
At this pages:
GetHyperCubePivotData method ‒ Qlik Sense
I found that it's possible to group elements like "NxInlineDimensionDef" with the property "qGrouping" = "H" for drill-down, but i can't understand how I place the Dimensions in the code, or what properties I have to use for reading the data in the javascript. I only achieved passing the 1st dimension values (Country).
Here goes my code:
me.createTable=function(){
app.obj.app.createCube({
"qDimensions": [{
"qDef": {
"qFieldDefs": ["Country"],
"qGrouping":"H"
},
"qNullSuppression": true,
"qOtherTotalSpec": {
"qOtherMode": "OTHER_OFF",
"qSuppressOther": true,
"qOtherSortMode": "OTHER_SORT_DESCENDING",
"qOtherCounted": {
"qv": "5"
},
"qOtherLimitMode": "OTHER_GE_LIMIT"
}
},
{
"qDef": {
"qFieldDefs": ["City"],
"qGrouping":"H"
},
"qNullSuppression": true,
"qOtherTotalSpec": {
"qOtherMode": "OTHER_OFF",
"qSuppressOther": true,
"qOtherSortMode": "OTHER_SORT_DESCENDING",
"qOtherCounted": {
"qv": "5"
},
"qOtherLimitMode": "OTHER_GE_LIMIT"
}
}],
"qMeasures": [
{
"qLabel": "Null_Votes",
"qLibraryId": "FeppgM",
"qSortBy": {
"qSortByState": 0,
"qSortByFrequency": 0,
"qSortByNumeric": 0,
"qSortByAscii": 1,
"qSortByLoadOrder": 0,
"qSortByExpression": 0,
"qExpression": {
"qv": " "
}
}
},
{
"qLabel": "TotalVotes",
"qLibraryId": "RvbWUtb",
"qSortBy": {
"qSortByState": 0,
"qSortByFrequency": 0,
"qSortByNumeric": 0,
"qSortByAscii": 1,
"qSortByLoadOrder": 0,
"qSortByExpression": 0,
"qExpression": {
"qv": " "
}
}
}
],
"qInitialDataFetch": [
{
"qTop" : 0,
"qLeft" : 0,
"qHeight": 200,
"qWidth": 5
}
],
//"qAlwaysFullyExpanded":true,
//"qShowTotalsAbove":true,
"qSuppressZero": true,
"qSuppressMissing": true,
"qMode": "P",
"qInterColumnSortOrder": [],
"qStateName": "$"
},function(reply) {
console.log(reply);
var country, city, null_Votes,totalVotes;
var Table=[];
var Data1 =reply.qHyperCube.qPivotDataPages[0].qLeft;
var Data2 =reply.qHyperCube.qPivotDataPages[0].qData;
for (var i=0; i<Data1.length; i++) {
country= Data1[i].qText;
//city= Data[1].qText;
Null_Votes= Data2[i][0].qNum;
TotalVotes = Data2[i][1].qNum;
Table.push({
Country:country,
//City:city,
Null_Votes:null_Votes,
TotalVotes:totalVotes,
});
}
$scope.Table = Table;
});
}
The result I'm getting:
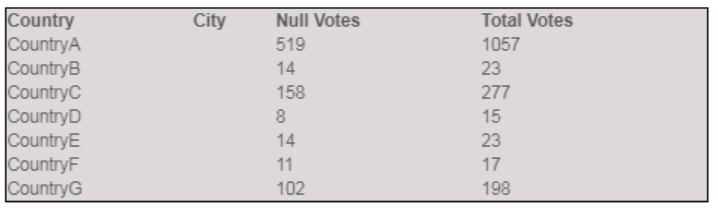
I want to, between each country, have the respective cities with the their values.
Thanks a lot for your feedbacks, ideas, suggestions, advices.
- Mark as New
- Bookmark
- Subscribe
- Mute
- Subscribe to RSS Feed
- Permalink
- Report Inappropriate Content
Hi,
Perhaps you should take a look at this example of using the Visualization API to create a pivot-table: https://help.qlik.com/en-US/sense-developer/September2017/Subsystems/APIs/Content/CapabilityAPIs/Vis...
Hope this helps
Erik Wetterberg
- Mark as New
- Bookmark
- Subscribe
- Mute
- Subscribe to RSS Feed
- Permalink
- Report Inappropriate Content
Thank you for your help Erik.
My problem is how I should do for having the two dimensions in the same group or for city depend on Country. Trying to, this way, for each country see theirs discriminated city values.