Unlock a world of possibilities! Login now and discover the exclusive benefits awaiting you.
- Qlik Community
- :
- All Forums
- :
- Integration, Extension & APIs
- :
- Bar Plus Color Expression
- Subscribe to RSS Feed
- Mark Topic as New
- Mark Topic as Read
- Float this Topic for Current User
- Bookmark
- Subscribe
- Mute
- Printer Friendly Page
- Mark as New
- Bookmark
- Subscribe
- Mute
- Subscribe to RSS Feed
- Permalink
- Report Inappropriate Content
Bar Plus Color Expression
Hi All
I am trying to implement the Bar Plus extension Qlik Branch in my application because my requirement is to display the individual values on the stacked bar but I cannot set the color expression to my chart.
Can anyone please help me with the solution?
The color expression I am using is mentioned below:
if(NewDays_Bucket = '0-90', rgb(216,191,216),
if(NewDays_Bucket = '90-180', rgb(186,85,211),
if(NewDays_Bucket = '180-365', rgb(255,185,92),
if(NewDays_Bucket = 'Above 365',rgb(255,99,71)))))
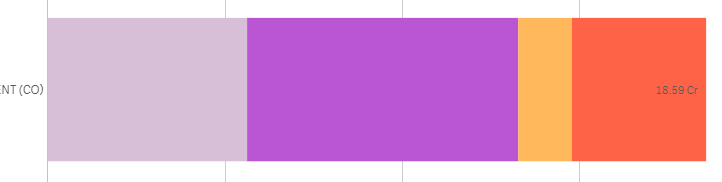
where NewDays_Bucket is my Dimension and I am using 2 dimensions:
1. Department Name
2. NewDays_Bucket
- Mark as New
- Bookmark
- Subscribe
- Mute
- Subscribe to RSS Feed
- Permalink
- Report Inappropriate Content
Go in your dimension options and put your color expression formular in "Dimension attribute" where you have added your dimension NewDays_Bucket
Then go in the options for "Colors and Legend" and set the color source to "Calculated" and set the color attribute to "Attribute is color value".
It's actually very well documented at https://developer.qlik.com/garden/5858f900c0568806cf368930
Just scroll down to the chapter "Calculated Colors".