Unlock a world of possibilities! Login now and discover the exclusive benefits awaiting you.
- Qlik Community
- :
- All Forums
- :
- Integration, Extension & APIs
- :
- Build Extension from D3js
- Subscribe to RSS Feed
- Mark Topic as New
- Mark Topic as Read
- Float this Topic for Current User
- Bookmark
- Subscribe
- Mute
- Printer Friendly Page
- Mark as New
- Bookmark
- Subscribe
- Mute
- Subscribe to RSS Feed
- Permalink
- Report Inappropriate Content
Build Extension from D3js
Hi Experts,
I'm new to build Qlik Sense Extension from D3js,
I start with two sites below, and the sample worked very well
http://www.axisgroup.com/tutorial-how-to-build-a-qlik-sense-extension-with-d3/
https://community.qlik.com/docs/DOC-16347
So I start to use this sample to build extension
https://bl.ocks.org/mbostock/4062085
But when I finish the code and import the dimensions and measures from test data,
It's always no error but all blank
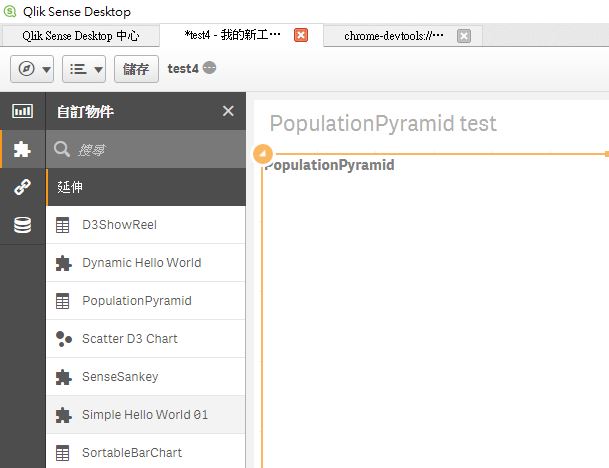
I also tried another D3js sample to use, but almost all samples are same problem
This is my code
/*globals define*/
define( ["qlik", "jquery", "text!./style.css", "./d3.v3.min"], function ( qlik, $, cssContent ) {
  'use strict';
  $( "<style>" ).html( cssContent ).appendTo( "head" );

  return {
  initialProperties: {
  qHyperCubeDef: {
  qDimensions: [],
  qMeasures: [],
  qInitialDataFetch: [{
  qWidth: 4,
  qHeight: 1000
  }]
  }
  },
  definition: {
  type: "items",
  component: "accordion",
  items: {
  dimensions: {
  uses: "dimensions",
  min: 3
  },
  measures: {
  uses: "measures",
  min: 1
  },
  sorting: {
  uses: "sorting"
  },
  settings: {
  uses: "settings"
  }
  }
  },
  snapshot: {
  canTakeSnapshot: true
  },
  paint: function ( $element, layout ) {
    //console.log($element);
    //console.log(layout);
    // get qMatrix data array
    var qMatrix = layout.qHyperCube.qDataPages[0].qMatrix;
    // create a new array that contains the measure labels
    var measureLabels = layout.qHyperCube.qMeasureInfo.map(function(d) {
        return d.qFallbackTitle;
    });
    // Create a new array for our extension with a row for each row in the qMatrix
    var data = qMatrix.map(function(d) {
        // for each element in the matrix, create a new object that has a property
        // for the grouping dimension, the first metric, and the second metric
        return {
            "Dim1":d[0].qText,
  "Dim2":d[1].qText,
            "Dim3":d[2].qText,
  "Metric1":d[3].qNum


        }
    });
    // Chart object width
    var width = $element.width();
    // Chart object height
    var height = $element.height();
    // Chart object id
    var id = "container_" + layout.qInfo.qId;

    // Check to see if the chart element has already been created
    if (document.getElementById(id)) {
        // if it has been created, empty it's contents so we can redraw it
        $("#" + id).empty();
    }
    else {
        // if it hasn't been created, create it with the appropiate id and size
        $element.append($('<div />;').attr("id", id).width(width).height(height));
    }

 viz(data,measureLabels,width,height,id);
  }
  };
} );
var viz = function (data,labels,width,height,id) {
var margin = {top: 20, right: 40, bottom: 30, left: 20},
    width = width - margin.left - margin.right,
    height = height - margin.top - margin.bottom,
    barWidth = Math.floor(width / 19) - 1;


var x = d3.scale.linear()
    .range([barWidth / 2, width - barWidth / 2]);


var y = d3.scale.linear()
    .range([height, 0]);


var yAxis = d3.svg.axis()
    .scale(y)
    .orient("right")
    .tickSize(-width)
    .tickFormat(function(d) { return Math.round(d / 1e6) + "M"; });


// An SVG element with a bottom-right origin.
var svg = d3.select("body").append("svg")
    .attr("width", width + margin.left + margin.right)
    .attr("height", height + margin.top + margin.bottom)
  .append("g")
    .attr("transform", "translate(" + margin.left + "," + margin.top + ")");


// A sliding container to hold the bars by birthyear.
var birthyears = svg.append("g")
    .attr("class", "birthyears");


// A label for the current year.
var title = svg.append("text")
    .attr("class", "title")
    .attr("dy", ".71em")
    .text(2000);


  // Compute the extent of the data set in age and years.
  var age1 = d3.max(data, function(d) { return d.Dim2; }),
      year0 = d3.min(data, function(d) { return d.Dim1; }),
      year1 = d3.max(data, function(d) { return d.Dim1; }),
      year = year1;


  // Update the scale domains.
  x.domain([year1 - age1, year1]);
  y.domain([0, d3.max(data, function(d) { return d.Matric1; })]);


  // Produce a map from year and birthyear to [male, female].
  data = d3.nest()
      .key(function(d) { return d.Dim1; })
      .key(function(d) { return d.Dim1 - d.Dim2; })
      .rollup(function(v) { return v.map(function(d) { return d.Matric1; }); })
      .map(data);


  // Add an axis to show the population values.
  svg.append("g")
      .attr("class", "y axis")
      .attr("transform", "translate(" + width + ",0)")
      .call(yAxis)
    .selectAll("g")
    .filter(function(value) { return !value; })
      .classed("zero", true);


  // Add labeled rects for each birthyear (so that no enter or exit is required).
  var birthyear = birthyears.selectAll(".birthyear")
      .data(d3.range(year0 - age1, year1 + 1, 5))
    .enter().append("g")
      .attr("class", "birthyear")
      .attr("transform", function(birthyear) { return "translate(" + x(birthyear) + ",0)"; });


  birthyear.selectAll("rect")
      .data(function(birthyear) { return data[year][birthyear] || [0, 0]; })
    .enter().append("rect")
      .attr("x", -barWidth / 2)
      .attr("width", barWidth)
      .attr("y", y)
      .attr("height", function(value) { return height - y(value); });


  // Add labels to show birthyear.
  birthyear.append("text")
      .attr("y", height - 4)
      .text(function(birthyear) { return birthyear; });


  // Add labels to show age (separate; not animated).
  svg.selectAll(".age")
      .data(d3.range(0, age1 + 1, 5))
    .enter().append("text")
      .attr("class", "age")
      .attr("x", function(age) { return x(year - age); })
      .attr("y", height + 4)
      .attr("dy", ".71em")
      .text(function(age) { return age; });


  // Allow the arrow keys to change the displayed year.
  window.focus();
  d3.select(window).on("keydown", function() {
    switch (d3.event.keyCode) {
      case 37: year = Math.max(year0, year - 10); break;
      case 39: year = Math.min(year1, year + 10); break;
    }
    update();
  });


  function update() {
    if (!(year in data)) return;
    title.text(year);


    birthyears.transition()
        .duration(750)
        .attr("transform", "translate(" + (x(year1) - x(year)) + ",0)");


    birthyear.selectAll("rect")
        .data(function(birthyear) { return data[year][birthyear] || [0, 0]; })
      .transition()
        .duration(750)
        .attr("y", y)
        .attr("height", function(value) { return height - y(value); });
  }
}
and css
.qv-object-PopulationPyramid div.qv-object-content-container {
}
.qv-object-PopulationPyramid svg {
  font: 10px sans-serif;
}
.qv-object-PopulationPyramid .y.axis path {
  display: none;
}
.qv-object-PopulationPyramid .y.axis line {
  stroke: #fff;
  stroke-opacity: .2;
  shape-rendering: crispEdges;
}
.qv-object-PopulationPyramid .y.axis .zero line {
  stroke: #000;
  stroke-opacity: 1;
}


.qv-object-PopulationPyramid .title {
  font: 300 78px Helvetica Neue;
  fill: #666;
}


.qv-object-PopulationPyramid .birthyear,
.age {
  text-anchor: middle;
}


.qv-object-PopulationPyramid .birthyear {
  fill: #fff;
}


.qv-object-PopulationPyramid rect {
  fill-opacity: .6;
  fill: #e377c2;
}


.qv-object-PopulationPyramid rect:first-child {
  fill: #1f77b4;
}
Can any one help me solve this problem?
Thanks!
- Mark as New
- Bookmark
- Subscribe
- Mute
- Subscribe to RSS Feed
- Permalink
- Report Inappropriate Content
I find my mistake at
- var svg = d3.select("body").append("svg")
It must change to
- var svg = d3.select("#"+id).append("svg")
It's worked now!