Unlock a world of possibilities! Login now and discover the exclusive benefits awaiting you.
- Qlik Community
- :
- All Forums
- :
- Integration, Extension & APIs
- :
- Re: Histogram without Scroll Bar
- Subscribe to RSS Feed
- Mark Topic as New
- Mark Topic as Read
- Float this Topic for Current User
- Bookmark
- Subscribe
- Mute
- Printer Friendly Page
- Mark as New
- Bookmark
- Subscribe
- Mute
- Subscribe to RSS Feed
- Permalink
- Report Inappropriate Content
Histogram without Scroll Bar
Hi all,
I'm new to Qlik Sense, so I'm still getting my feet wet here.I'm trying to create a histogram as shown in the below image.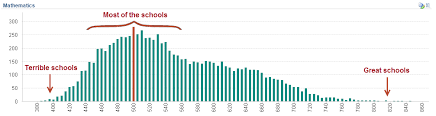
I need to reduce the Bar chart width so that I can exclude the scroll bar. Also, the intervals should be shown as in the above image.
I've tried looking at other postings but I'm not being able to translate them to my reality. Any assistance will be very welcome.
Please refer the below attached .qvf file for sample data.
Thanks !
- Tags:
- histogram
- scroll bars
Accepted Solutions
- Mark as New
- Bookmark
- Subscribe
- Mute
- Subscribe to RSS Feed
- Permalink
- Report Inappropriate Content
I don't see the point of doing so.. But, you can maybe use extensions?
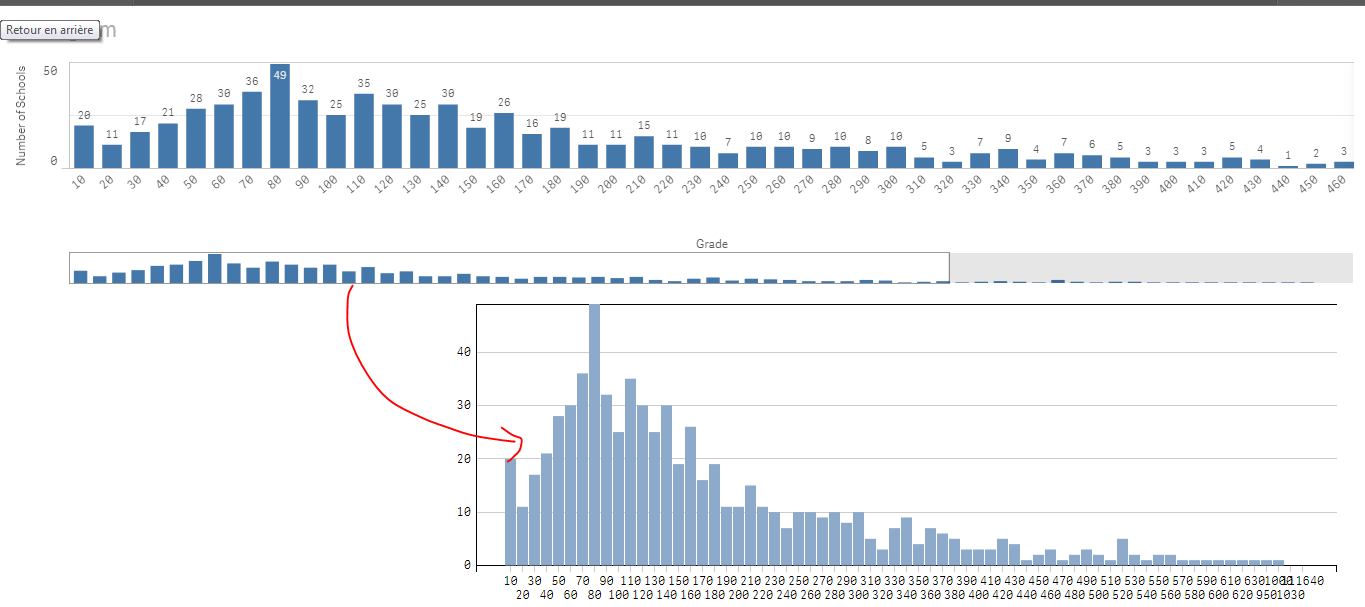
Maybe sthing like this?
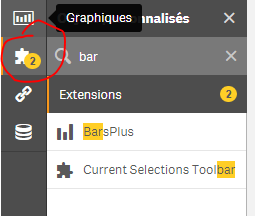
Download the extension from here:
http://branch.qlik.com/#!/project/5858f900c0568806cf368930
Then inzip it and put it under : C:\Users\YourUser\Documents\Qlik\Sense\Extensions
You'll find it here:
See the attached app
- Mark as New
- Bookmark
- Subscribe
- Mute
- Subscribe to RSS Feed
- Permalink
- Report Inappropriate Content
I don't see the point of doing so.. But, you can maybe use extensions?
Maybe sthing like this?
Download the extension from here:
http://branch.qlik.com/#!/project/5858f900c0568806cf368930
Then inzip it and put it under : C:\Users\YourUser\Documents\Qlik\Sense\Extensions
You'll find it here:
See the attached app
- Mark as New
- Bookmark
- Subscribe
- Mute
- Subscribe to RSS Feed
- Permalink
- Report Inappropriate Content
Hi Omar,
Issue Solved, The extension works perfectly.
Thank you so much