Unlock a world of possibilities! Login now and discover the exclusive benefits awaiting you.
- Qlik Community
- :
- All Forums
- :
- Integration, Extension & APIs
- :
- How to Correctly Setup Heatmapping Extension?
- Subscribe to RSS Feed
- Mark Topic as New
- Mark Topic as Read
- Float this Topic for Current User
- Bookmark
- Subscribe
- Mute
- Printer Friendly Page
- Mark as New
- Bookmark
- Subscribe
- Mute
- Subscribe to RSS Feed
- Permalink
- Report Inappropriate Content
How to Correctly Setup Heatmapping Extension?
Hey Qlik Community, I recently installed this Qlik Branch project for our Qlik Sense Server, the 2 Dimensional Heatmap and while we followed the instruction guidelines (load the zip file in QMC) we have been unable to deploy it as displayed in the previews where multiple dimensions drive the heatmap.
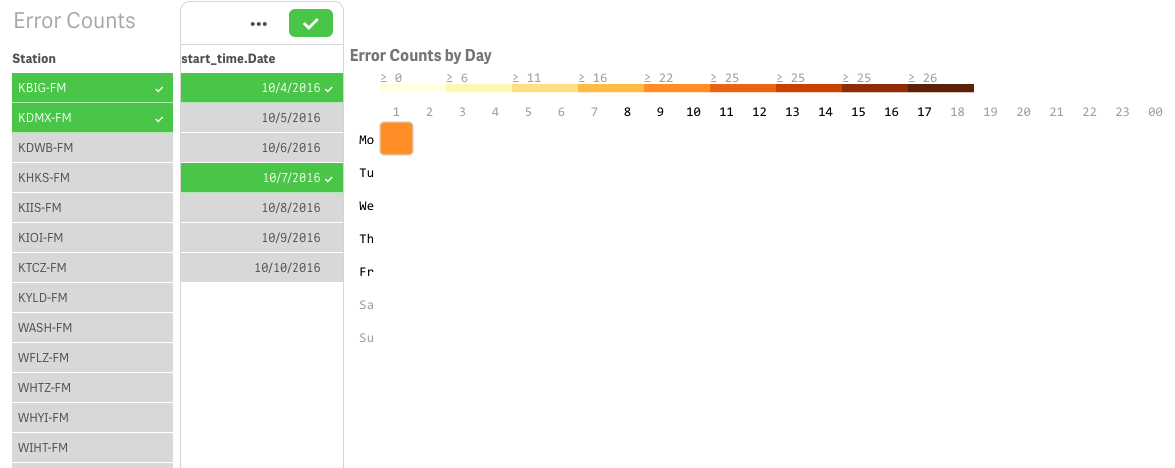
Goal/Expectation: Use 2 Dimensions (Radio Station,Start Time) to track how many Errors are encountered on a station level daily.
Encountered Result:

The data keeps getting "bunched" into Monday, October 10th-- we have experienced this with another Extension, so is it something related to our data and how we loaded it from Qlik (via .csv)?
Here's a snapshot from the table headers this sheet is pulling from:

Qlik recognizes the 'start_time' field as a date field, but why is all the data getting lumped into one little 'square' tile for Monday? And how can we add an additional dimension that groups by the Station field row by row?
- Mark as New
- Bookmark
- Subscribe
- Mute
- Subscribe to RSS Feed
- Permalink
- Report Inappropriate Content
This is some other extension used (I guess d3 week heatmap) but not the 2 Dimensional Heatmap.