Unlock a world of possibilities! Login now and discover the exclusive benefits awaiting you.
- Qlik Community
- :
- All Forums
- :
- Integration, Extension & APIs
- :
- Re: Mashup custom CSS
- Subscribe to RSS Feed
- Mark Topic as New
- Mark Topic as Read
- Float this Topic for Current User
- Bookmark
- Subscribe
- Mute
- Printer Friendly Page
- Mark as New
- Bookmark
- Subscribe
- Mute
- Subscribe to RSS Feed
- Permalink
- Report Inappropriate Content
Mashup custom CSS
Hi,
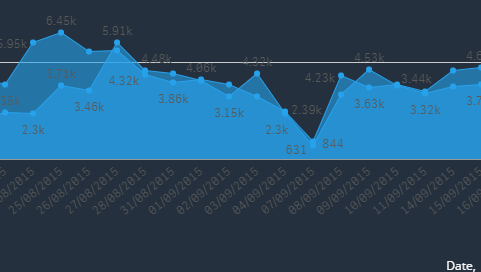
I have been trying to change the text color on the X & Y axis and the labels on mashup - line chart in this case; Tried to set the color on a bunch of classes including .qv-chart-component-axis. I am not able to figure out the correct element/class for this one.
Hoping someone has done this before. Could you please point me in the right direction?
Thanks!
- Mark as New
- Bookmark
- Subscribe
- Mute
- Subscribe to RSS Feed
- Permalink
- Report Inappropriate Content
Hi,
Native objects use canvas to paint the axis and labels, so I'm afraid It's not possible to override the CSS to change the colors. The solution would be to create a visualization extension so you can personalize it as much as you need.
- Mark as New
- Bookmark
- Subscribe
- Mute
- Subscribe to RSS Feed
- Permalink
- Report Inappropriate Content
Thanks Jose;
Got it to work by changing the embedded theme.json in require.js
So On Desktop:
C:\Users\%USERNAME%\AppData\Local\Programs\Qlik\Sense\Client\assets\external\requirejs
Server:
C:\Program Files\Qlik\Sense\Client\assets\external\requirejs
- Mark as New
- Bookmark
- Subscribe
- Mute
- Subscribe to RSS Feed
- Permalink
- Report Inappropriate Content
Interesting! Wouldn't that affect all objects in the hub??
- Mark as New
- Bookmark
- Subscribe
- Mute
- Subscribe to RSS Feed
- Permalink
- Report Inappropriate Content
Yes it does but you can change colors of individual chart types as well; Apparently the next service release due in November will have extended support for themes.
I think you could also copy the whole theme.json from the highvis folder and link that in require.js. In my case, I am using QAP so there is no hub.
- Mark as New
- Bookmark
- Subscribe
- Mute
- Subscribe to RSS Feed
- Permalink
- Report Inappropriate Content
Hi! I was wondering if I could ask a bit more about customizing the charts via CSS! I don't have a lot of Qlik experience but was hoping to be able to style some of my embedded charts via CSS with Qlik 3.1. I can get alternate style sheets/json files to load on my webpage with using the /theme= parameters (and I will try this require.js method as well so I don't have to change my url), Thanks!
But I don't see any hooks on the chart <canvas /> elements that would allow me to target my CSS. Looking at the charts rendered with the Chrome developer tool, I can't see how I can use css to target the chart colors. Any help or pointers would be greatly appreciated!
- Mark as New
- Bookmark
- Subscribe
- Mute
- Subscribe to RSS Feed
- Permalink
- Report Inappropriate Content
You can't use CSS to target stuff inside a canvas element. Canvas API - Web APIs | MDN
- Mark as New
- Bookmark
- Subscribe
- Mute
- Subscribe to RSS Feed
- Permalink
- Report Inappropriate Content
Thanks so much... Does Qlik offer any other output options for charts other than the canvas element? Thanks again, really appreciate the input on this!
- Mark as New
- Bookmark
- Subscribe
- Mute
- Subscribe to RSS Feed
- Permalink
- Report Inappropriate Content
You can always use extensions. But the thing with canvas is it's not making dom manipulations, so it's usually much faster than svg.
You could refer to Aravind Sasidharan's comment above, but that's currently not supported.
- Mark as New
- Bookmark
- Subscribe
- Mute
- Subscribe to RSS Feed
- Permalink
- Report Inappropriate Content
I think it depends on the type of customization that you want to do. In my case, I had a mashup (running on QAP) with a dark background and Qlik default theme is for light background so the only option was to hack require.js.
Open require.js and search for the chart type.
E.g. scatterPlot; You will see something similar to this. Now you can tweak the values.
scatterPlot":{
\n "value":{
\n "color":"@labelLowContrast",
\n "fontSize":"12px",
\n "background":"rgba(0,0,0,0)" \n
},
\n "shape":{
\n "border":{
\n "width":{
\n "default":1,
\n "selected":2 \n
},
\n "color":"rgba(0,0,0,0.7)" \n
},
\n "outOfBounds":{
\n "opacity":0.3 \n
} \n
},
\n "line":{
\n "color":"@lineHighContrast",
\n "width":1 \n
} \n
}
Again, as Francis mentioned this is not supported by Qlik and may break especially when you migrate to a new feature release. In 3.2, You may also want to override some of the properties in client.css
e.g
.qv-object {
…
background-color: #FFFFFF;
}