Unlock a world of possibilities! Login now and discover the exclusive benefits awaiting you.
- Qlik Community
- :
- All Forums
- :
- Integration, Extension & APIs
- :
- Qlik Sense Extension Dynamic Resizing
Options
- Subscribe to RSS Feed
- Mark Topic as New
- Mark Topic as Read
- Float this Topic for Current User
- Bookmark
- Subscribe
- Mute
- Printer Friendly Page
Turn on suggestions
Auto-suggest helps you quickly narrow down your search results by suggesting possible matches as you type.
Showing results for
Contributor III
2017-12-10
12:56 PM
- Mark as New
- Bookmark
- Subscribe
- Mute
- Subscribe to RSS Feed
- Permalink
- Report Inappropriate Content
Qlik Sense Extension Dynamic Resizing
Hi Community,
I'm trying to develop a responsive Bar Chart extension using d3.js for Qlik Sense. I have successfully created the bar chart. But there are a lot of issues regarding the responsiveness of the chart.
I have used paint function for handling all the data changes and resize function for rendering.
Now I'm dynamically calculating the width and size of the bars and scales. But I find difficulty in placing the axis label and titles and calculating the width/height and margins of it dynamically according to the extension width/height.
Any suggestion for solving this issue.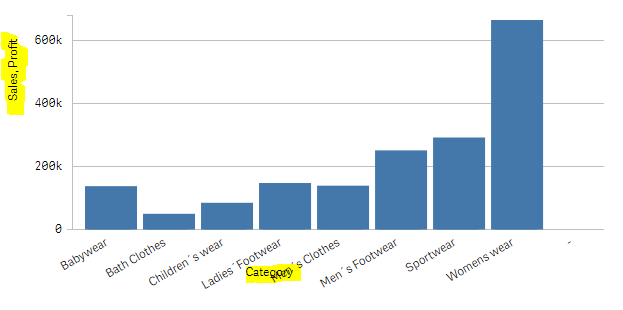
Any help is greatly appreciated
Thanks in advance.
Stan
743 Views
0 Replies