Unlock a world of possibilities! Login now and discover the exclusive benefits awaiting you.
- Qlik Community
- :
- All Forums
- :
- Integration, Extension & APIs
- :
- Show or define the range of a slider in a barchart
- Subscribe to RSS Feed
- Mark Topic as New
- Mark Topic as Read
- Float this Topic for Current User
- Bookmark
- Subscribe
- Mute
- Printer Friendly Page
- Mark as New
- Bookmark
- Subscribe
- Mute
- Subscribe to RSS Feed
- Permalink
- Report Inappropriate Content
Show or define the range of a slider in a barchart
Hello everybody,
I'm trying to show the chosen date in a barchart with a non-continuous x-axis, which the users can scale themselves by the slider.

To the fact, that there is no selection, I can't use the max or min-date.
Is there any solution or an extention to display the Dates?
On top, is there a way a user can choose the range of date by defining the range of the slider like in the barchart on top without doing a selection?
Thanks!
Saskia
- Mark as New
- Bookmark
- Subscribe
- Mute
- Subscribe to RSS Feed
- Permalink
- Report Inappropriate Content
Hi Saskia,
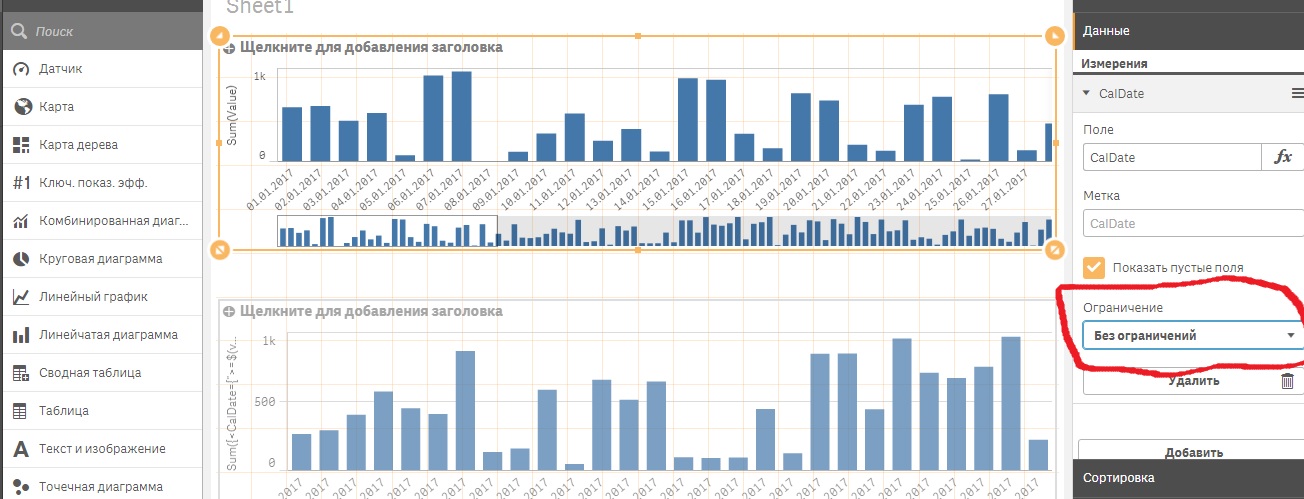
Maybe for your task will help Set Analisys? In the attached file there are no restrictions on the top chart. On the lower chart, assigning values to variables vMinDate and vMaxDate, we limit the size of the dimension.
Regards,
Andrey
- Mark as New
- Bookmark
- Subscribe
- Mute
- Subscribe to RSS Feed
- Permalink
- Report Inappropriate Content
In addition, you can apply the dimension settings Qlik Sense.