Unlock a world of possibilities! Login now and discover the exclusive benefits awaiting you.
- Qlik Community
- :
- All Forums
- :
- QlikView Administration
- :
- Adding my own data to Governance Dashboard
- Subscribe to RSS Feed
- Mark Topic as New
- Mark Topic as Read
- Float this Topic for Current User
- Bookmark
- Subscribe
- Mute
- Printer Friendly Page
- Mark as New
- Bookmark
- Subscribe
- Mute
- Subscribe to RSS Feed
- Permalink
- Report Inappropriate Content
Adding my own data to Governance Dashboard
I think my question is related to this post, but I didn't want to hijack it since it was already marked as Answered and I didn't understand how to do option 1. I'm not really interested in doing option 2.
Basically, what I'd like to do is add some more data to the Governance Dashboard so that the information is a bit more useful for our situation. Specifically, the "Authenticated_User" field on the "SessionTaskAuditMaster" table contains the login of the user. Problem is that the login is a number and it's hard to tell exactly who that is. I want to add a table that has "Authenticated_User" on it and also a "User_Name" from the LDAP so that we can modify the charts that show "Authenticated_User" to show "User_Name" instead.
My first attempt was to try it in the existing QVW, but then I found out about the hidden script. So then I tried doing a binary load in a brand new QVW. That worked fine, but the new QVW obviously didn't have the UI from the Governance Dashboard QVW. I thought I could just select all the objects in the Governance Dashboard QVW, Copy them and then Paste them to the new QVW and I'd be good to go. That didn't exactly work as I expected. There must be a bunch of objects (macros, variables, etc?) that don't get copied using the method I just described.
So now I'm stuck. I don't know how to accomplish what I want without manually recreating all the objects from the Governance Dashboard in my new QVW.
Thanks in advance for any help.
Accepted Solutions
- Mark as New
- Bookmark
- Subscribe
- Mute
- Subscribe to RSS Feed
- Permalink
- Report Inappropriate Content
Great to hear!
And, there is no need to apologize about questions, especially about the UI. I confess that when I first started developing (the already existing) app, I had MANY questions. So much complexity and layering and conditional showing of objects to make it look clean and sleek - makes modifying existing things challenging.
On the summary page, each area has a transparent text object in front of the chart(s) behind - the text object acts as a button to switch over to the page which has more info about the chart you see on the Summary.
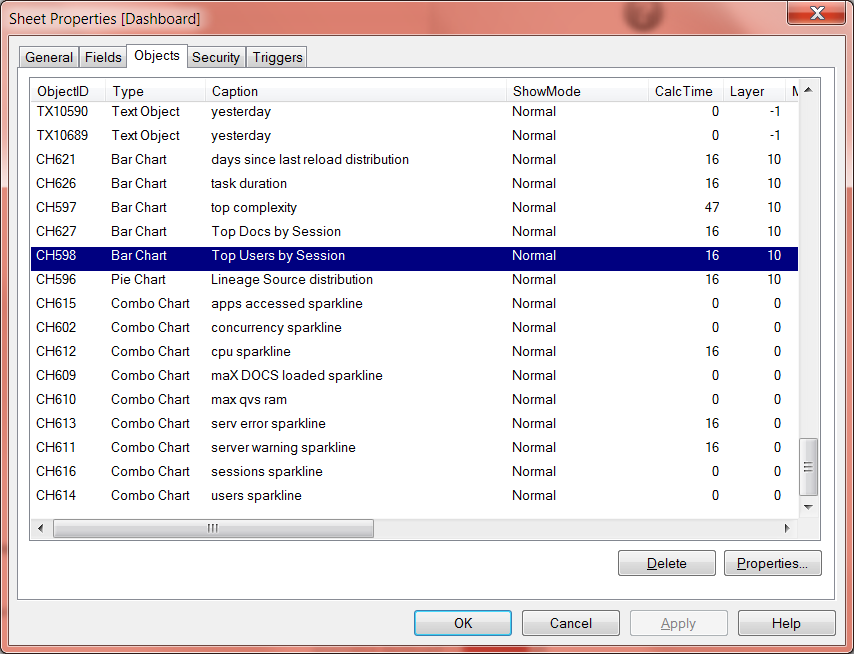
When I modify the GovDB summary page, I usually access the Sheet Properties and scroll through the objects to find the one of interest and click "Properties" there.
 \
\
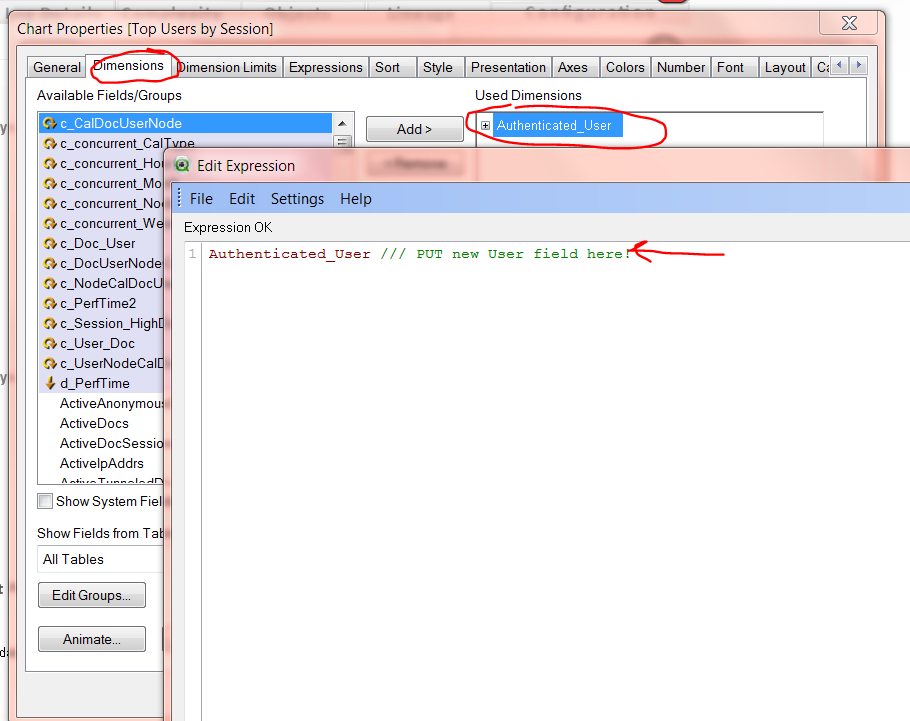
Then change the dimension by clicking "Edit" on Authenticated_User (as opposed to removing it and adding a new one):

- Mark as New
- Bookmark
- Subscribe
- Mute
- Subscribe to RSS Feed
- Permalink
- Report Inappropriate Content
If you do not want to do option 2 (binary load after removing hidden script), Option 1 is currently your only other option - which is to include some load script in a .txt file and reference it using the User Config script (as briefly described here). (I know you've seen this post - but I include it for reference of first-timers to this post.)
Concerning the load script to use to get Active Directory info in QlikView, this post on Qlik Community might be helpful:
http://community.qlik.com/message/371016#371016
Rob Wunderlich has a qvw there that has some script (part of which is included below). I’m not sure if it is UserName or UserDN that would be aliased as [Authenticated User].
SET RootDse = 'DC=mycompany, DC=com';
/*
Read names from Active Directory using AdsDSO.
Active Directory returns a maximum number (pagesize) of rows per call.
The loop below will get all the rows regardless of the pagesize.
*/
CONNECT TO 'Provider=ADsDSOObject';
LET arg=chr(01); // Set search start name to a very low value
DO
ADUsers:
//FIRST 1000 // Workaround for undefined SQL error.
LOAD DISTINCT
// Add addtional Fields as required
name as UserName,
distinguishedName as UserDN
;
SQL select
// Add addtional Fields as required
name, distinguishedName // Fields to select
FROM 'LDAP://$(RootDse)' WHERE objectCategory='person'
AND name>'$(arg)'; // Get rows where "name" is GT the arg
EXIT DO WHEN ScriptError > 1 // Stop loop if SELECT has error
EXIT DO WHEN NoOfRows('nameTable') = 0; // Stop loop if SELECT returns nothing
EXIT DO WHEN peek('UserName') = '$(arg)'; // If the last "name" read is EQ to arg -- no more entries
LET arg=peek('UserName'); // Set the arg to the last "name" read
LOOP
/*
Read names from Active Directory using AdsDSO.
Active Directory returns a maximum number (pagesize) of rows per call.
The loop below will get all the rows regardless of the pagesize.
*/
CONNECT TO 'Provider=ADsDSOObject';
LET arg=chr(01); // Set search start name to a very low value
DO
ADGroups:
LOAD
name as GroupName,
distinguishedName as GroupDN,
info as GroupInfo
;
SQL select
name, distinguishedName,
info
FROM 'LDAP://$(RootDse)' WHERE objectCategory='group'
AND name>'$(arg)'; // Get rows where "name" is GT the arg
EXIT DO WHEN ScriptError > 1 // Stop loop if SELECT has error
EXIT DO WHEN NoOfRows('nameTable') = 0; // Stop loop if SELECT returns nothing
EXIT DO WHEN peek('GroupName') = '$(arg)'; // If the last "name" read is EQ to arg -- no more entries
LET arg=peek('GroupName'); // Set the arg to the last "name" read
LOOP
/*
Load Group Member names
*/
LET arg= NoOfRows('ADGroups');
For i = 0 to NoOfRows('ADGroups') - 1
LET Group = peek('GroupDN', $(i), 'ADGroups');
ADGroupMembers:
LOAD DISTINCT
distinguishedName as UserDN, '$(Group)' as GroupDN;
SELECT distinguishedName
FROM 'LDAP://$(RootDse)' WHERE MemberOf='$(Group)';
NEXT i;
- Mark as New
- Bookmark
- Subscribe
- Mute
- Subscribe to RSS Feed
- Permalink
- Report Inappropriate Content
Tyler,
Thanks for the quick reply. First, I already have some QVDs with Active Directory data so I'm OK on that front. What I was really looking for was how to include those with the data from the Governance Dashboard.
Maybe I didn't understand the two options correctly. Here's what I thought they meant:
Option 1: This allows me to specify different paths for the various variables. I didn't understand how that helps me use my load script. In the example, the script referred to just contains a bunch of SET statements. Are you saying I can also include my own load statements in that file?
Option 2: The statement that "option 2 gets you into the 'not supported' realm, so proceed at your own risk" kind of scared me off that option. I'll try it just to see how it works and post the result.
Thanks again for the help.
- Mark as New
- Bookmark
- Subscribe
- Mute
- Subscribe to RSS Feed
- Permalink
- Report Inappropriate Content
OK, making some progress. Tried option 2 and that worked.
So then I tried to make the change to the UI so that instead of showing network id, it shows the user's actual name. I right-click on the Most Active Users chart on the Dashboard "tab" and select Properties. I expected to see the properties of a chart. Instead, I'm seeing properties of a Text Object.
Please excuse me if this is a basic question, but I've never seen something like that. How is it displaying a chart in a Text object? How do I change the properties of the chart?
Thanks.
- Mark as New
- Bookmark
- Subscribe
- Mute
- Subscribe to RSS Feed
- Permalink
- Report Inappropriate Content
Great to hear!
And, there is no need to apologize about questions, especially about the UI. I confess that when I first started developing (the already existing) app, I had MANY questions. So much complexity and layering and conditional showing of objects to make it look clean and sleek - makes modifying existing things challenging.
On the summary page, each area has a transparent text object in front of the chart(s) behind - the text object acts as a button to switch over to the page which has more info about the chart you see on the Summary.
When I modify the GovDB summary page, I usually access the Sheet Properties and scroll through the objects to find the one of interest and click "Properties" there.
 \
\
Then change the dimension by clicking "Edit" on Authenticated_User (as opposed to removing it and adding a new one):

- Mark as New
- Bookmark
- Subscribe
- Mute
- Subscribe to RSS Feed
- Permalink
- Report Inappropriate Content
Fantastic! Thanks so much for the help Tyler. That made sense and worked like a charm.