Unlock a world of possibilities! Login now and discover the exclusive benefits awaiting you.
- Qlik Community
- :
- All Forums
- :
- QlikView Administration
- :
- Do not get certain info out of the Governance Dash...
- Subscribe to RSS Feed
- Mark Topic as New
- Mark Topic as Read
- Float this Topic for Current User
- Bookmark
- Subscribe
- Mute
- Printer Friendly Page
- Mark as New
- Bookmark
- Subscribe
- Mute
- Subscribe to RSS Feed
- Permalink
- Report Inappropriate Content
Do not get certain info out of the Governance Dashboard
Hello Community,
I've installed the Governance Dashboard 1.1 on the Qlikview Server, however I've got an issue I cannot resolve.
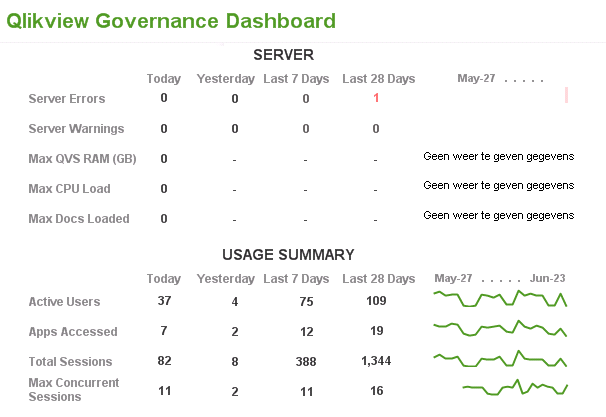
As stated in the picture below, I do not receive information about the Max QVS RAM, Max CPU Load and Max Docs Loaded.
Does anyone have any idea how to resolve this issue?
- Mark as New
- Bookmark
- Subscribe
- Mute
- Subscribe to RSS Feed
- Permalink
- Report Inappropriate Content
K E,
The performance metrics (CPU, RAM, etc.) come from the server "Performance.log" files which reside in the same folder as the Sessions, Events, and Audit logs. Given that you are getting information for "Sessions" and "Events" (the server error) I'd say that you have pointed to the correct server log folder.
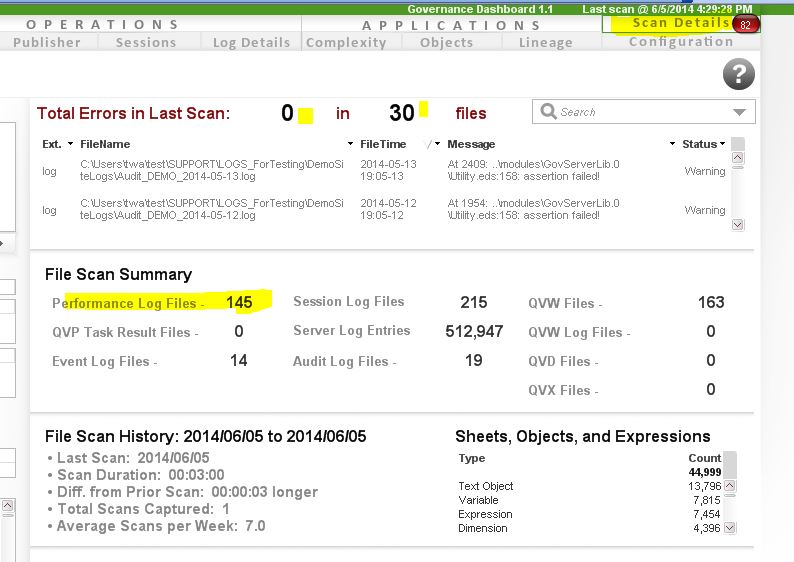
What does the Scan Results tab look like? Does it show scan errors? How many Performance logs does it say it read?
Also, is it possible that you are pointing to the same folder for both Server log files and also "documents"? In other words, is the server log folder a sub-folder within the "Documents to Scan" folder?
- Mark as New
- Bookmark
- Subscribe
- Mute
- Subscribe to RSS Feed
- Permalink
- Report Inappropriate Content
Hello Tyler,
Thank you for your reply.
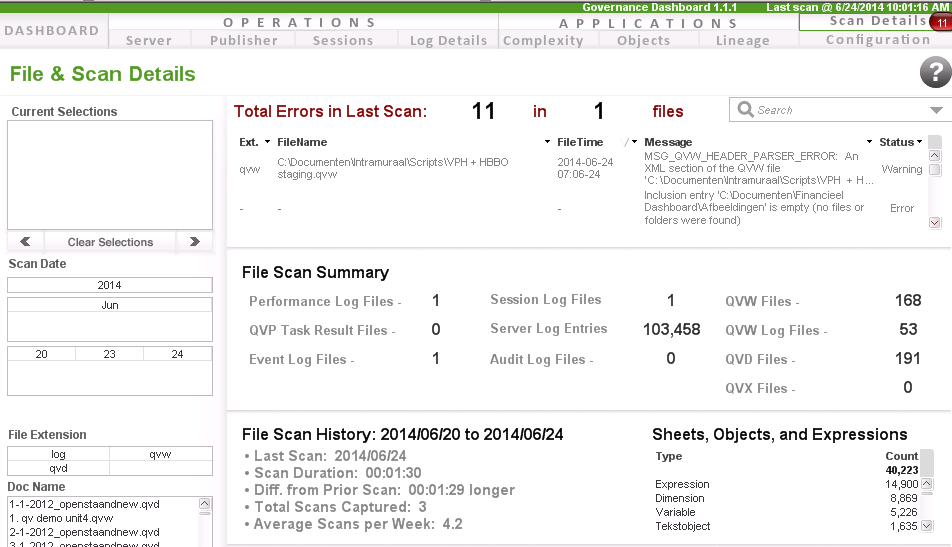
I do get some scan errors, but these are errors because some of the folders it is scanning are empty.
As you can see on the second screenshot, it only loads one performance log file.
That seems to be correct though, as far as I can tell there is only one performance log file in the stated logpath.
This is my current configuration page:

- Mark as New
- Bookmark
- Subscribe
- Mute
- Subscribe to RSS Feed
- Permalink
- Report Inappropriate Content
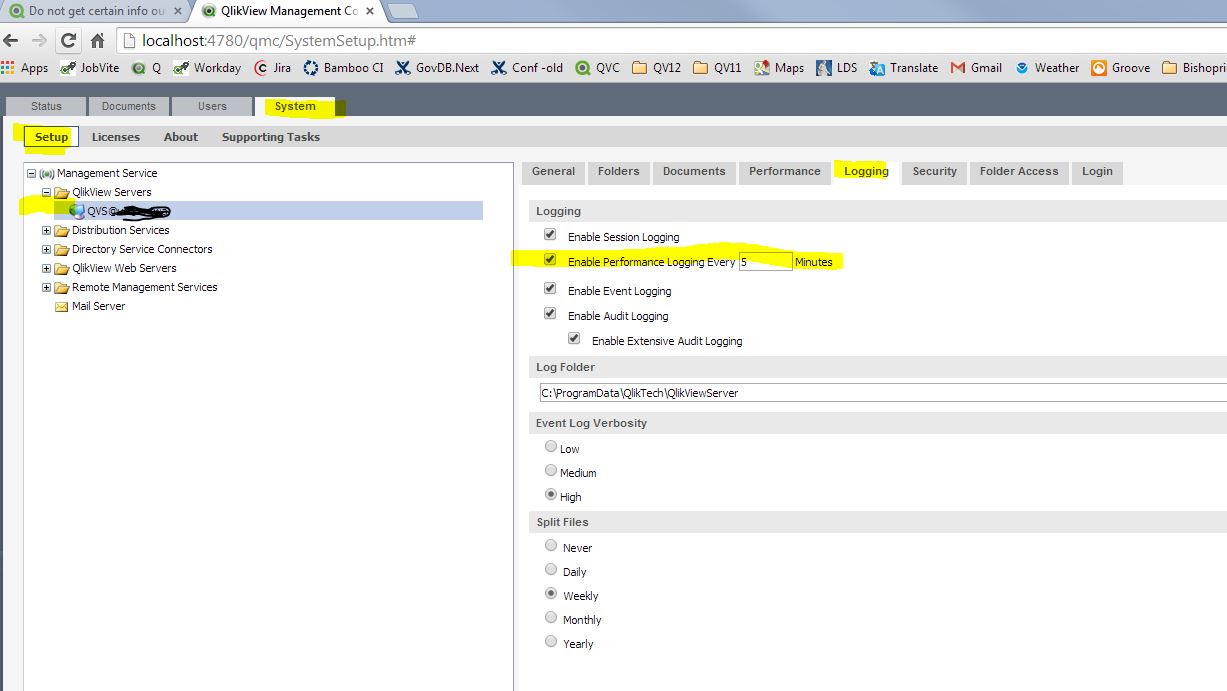
So it sounds like the GovDB is loading all the files it should but maybe the QlikView server itself is no producing the Performance logs as it should.
Can you check the Server logging settings in QMC to see if they are set?