Unlock a world of possibilities! Login now and discover the exclusive benefits awaiting you.
- Qlik Community
- :
- All Forums
- :
- QlikView Administration
- :
- Re: Is QVS hung or not?
- Subscribe to RSS Feed
- Mark Topic as New
- Mark Topic as Read
- Float this Topic for Current User
- Bookmark
- Subscribe
- Mute
- Printer Friendly Page
- Mark as New
- Bookmark
- Subscribe
- Mute
- Subscribe to RSS Feed
- Permalink
- Report Inappropriate Content
Is QVS hung or not?
QV Peers – I’m looking for some troubleshooting advice, recommendations, clarification, and advice on this issue. My environment is QV 12.10 SR6, QVS cluster with 2-nodes [Loaded Document load balancing] (QVDS, QMC, QVWS all on separate nodes as well), QVS Event Log Verbosity = High.
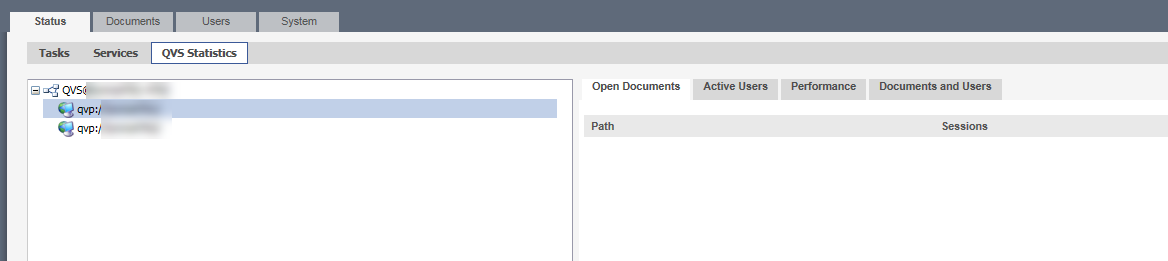
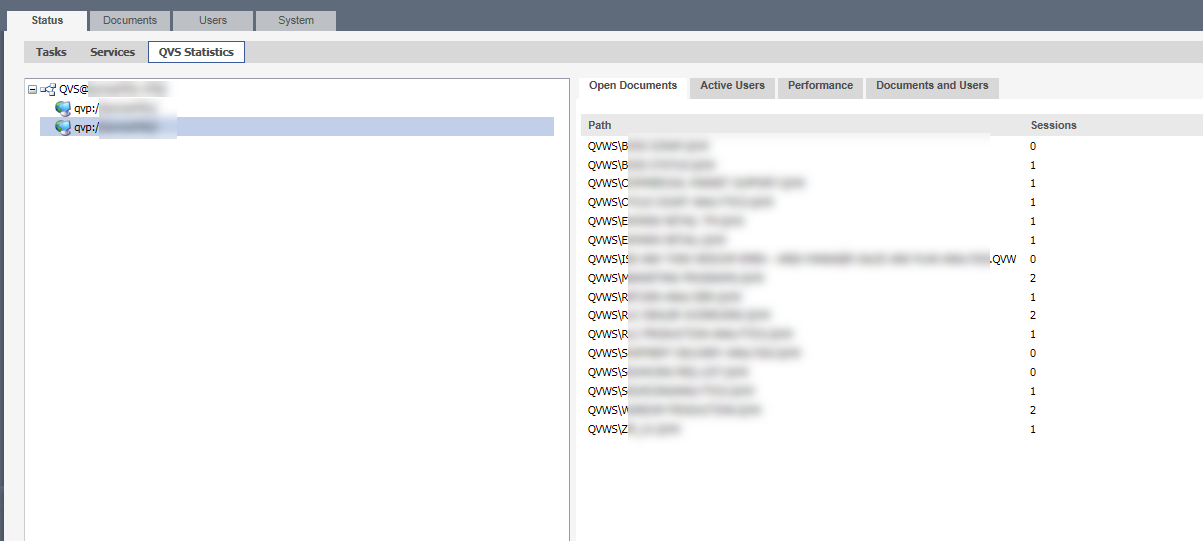
Issue: Over the last 3 months I’ve noticed that about once a week in the QMC, QVS Statistics shows that one of our QVS nodes has no documents loaded, while the other has ~15 documents loaded. QMC Status->Services shows both QVS nodes as “green”, and no users are reporting any problems. In AccessPoint I select an application which is not loaded and load it – it loads on the “good” QVS node, and not on the QVS node with zero apps loaded. The server is not showing any issues – memory consumption is around half, and CPU is idle. I restart the QVS on the “bad node” and notice that applications are now loading on both nodes. No Errors are recorded in the logs. I’m puzzled – this appears to have been a hung QVS, but Qlik did not indicate it as such.
Can any of you clarify:
- When QVS Statistics loads, can it time out? That is can the QMC show that no apps are loaded on the QVS Node erroneously because the query between the QMC and the QVS node timed out? When QVS Statistics shows no apps loaded – can I actually trust that?
- When QMC Services shows that QVS is “green” – what does that actually mean? Is that the same as the Windows OS showing the QVS service as “running” or does the QMC attempt to “connect” to the QVS for a deeper level of interrogation? If the status is “green” – can I trust that, or might the QVS still be hung up and show as green?
- Anyone else experience issues where a QVS node is hung up, but the QMC doesn’t indicate issues?
- Under the “Loaded Document” load balancing algorithm, when QVWS is deciding which QVS node to utilize – how does it do this (beyond the help documentation explanation)? Does it run a query against the QVS to see what’s loaded (and is there a way I can run this same query)? Might this query timeout causing the load balance algorithm to suddenly favor a specific node (and can this timeout be adjusted in a settings file)?
- If a specific QV application is hanging my QVS node – what do I look for in the logs? Excessive memory utilization? Do I look for apps unloading as they “fail over” to the other node? How might I pinpoint the problematic application (we have ~150 apps)?
- If the QVS is hung why would QMC show it green?
Any other advice, troubleshooting tips, or things to consider? (FYI – I have previously implemented changes suggested by QlikSupport but it did not resolve my issue).
Thanks in advance for any input!
Accepted Solutions
- Mark as New
- Bookmark
- Subscribe
- Mute
- Subscribe to RSS Feed
- Permalink
- Report Inappropriate Content
I believe I understand what is happening here - and it appears to be by design (so to answer my question, no - QVS is not hung).
To recap I noticed that occasionally many apps (>40) were loading on one QVS node while zero were loading on the other. This prompted me to suspect a problem with my QVS node. When I restarted the node, the situation immediately resolved, which reinforced my opinion I had a QVS problem.
I adjusted my QVWS logging to High, and enabled Utilization logging. The info captured was able to show me how QVWS was making the decision regarding what QVS node to load the QVW on.
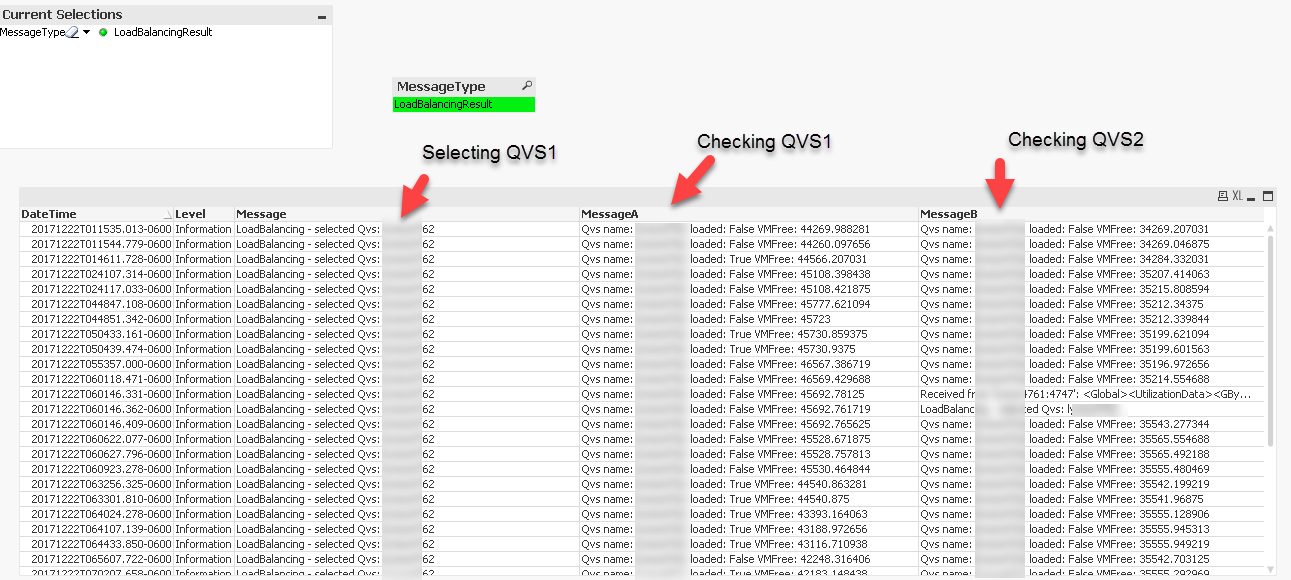
Looking at the logs, QVWS is checking both nodes and during this time frame always selecting QVS1 to load the app on. This is because even though QVS1 has multiple apps on it, it still has the most amount of free memory.
So why is it that QVS2, which has no applications loaded, is the node with the least free memory? My thoughts are that the memory is full with the QV Cache from applications used recently (the prior day) but have reached their document timeout and have been unloaded from memory. I can also confirm that memory utilization on QVS1 eventually grows where my apps start loading on to QVS2. While this situation may look alarming at first, it appears to be perfectly normal.
In retrospect, restarting QVS will clear the Cache and free up all the memory. The QVWS load balancing algorithm will immediately favor the newly restarted QVS node making it appear to me that my restart "fixed" the problem (when in reality there was no problem).
Qlik Design Blog - The QlikView Cache:
- Mark as New
- Bookmark
- Subscribe
- Mute
- Subscribe to RSS Feed
- Permalink
- Report Inappropriate Content
Some relevent notes from my Qlik Support ticket:
The QVWS will determine what QVS to use based on the load balancing algorithm selected. With loaded document algorithm, if the document is not yet loaded, QVWS looks at each QVS node and uses the CPU with RAM overload algorithm to pick a node. To review/troubleshoot this check "Enable Utilization Logging" on the QVWS resources and turn the logging level up to high. In the QVWS logs you will see QVWS checking each QVS node, the resource statistics it found, and eventually the QVS node it chose. Reviewing this information will tell you why QVWS chose the QVS node it did at the time.
Other relevant things to consider would be QVW preloading (to specific nodes), document timeouts, and QVS nodes handling distributions for QVDS.
- Mark as New
- Bookmark
- Subscribe
- Mute
- Subscribe to RSS Feed
- Permalink
- Report Inappropriate Content
I believe I understand what is happening here - and it appears to be by design (so to answer my question, no - QVS is not hung).
To recap I noticed that occasionally many apps (>40) were loading on one QVS node while zero were loading on the other. This prompted me to suspect a problem with my QVS node. When I restarted the node, the situation immediately resolved, which reinforced my opinion I had a QVS problem.
I adjusted my QVWS logging to High, and enabled Utilization logging. The info captured was able to show me how QVWS was making the decision regarding what QVS node to load the QVW on.
Looking at the logs, QVWS is checking both nodes and during this time frame always selecting QVS1 to load the app on. This is because even though QVS1 has multiple apps on it, it still has the most amount of free memory.
So why is it that QVS2, which has no applications loaded, is the node with the least free memory? My thoughts are that the memory is full with the QV Cache from applications used recently (the prior day) but have reached their document timeout and have been unloaded from memory. I can also confirm that memory utilization on QVS1 eventually grows where my apps start loading on to QVS2. While this situation may look alarming at first, it appears to be perfectly normal.
In retrospect, restarting QVS will clear the Cache and free up all the memory. The QVWS load balancing algorithm will immediately favor the newly restarted QVS node making it appear to me that my restart "fixed" the problem (when in reality there was no problem).
Qlik Design Blog - The QlikView Cache: